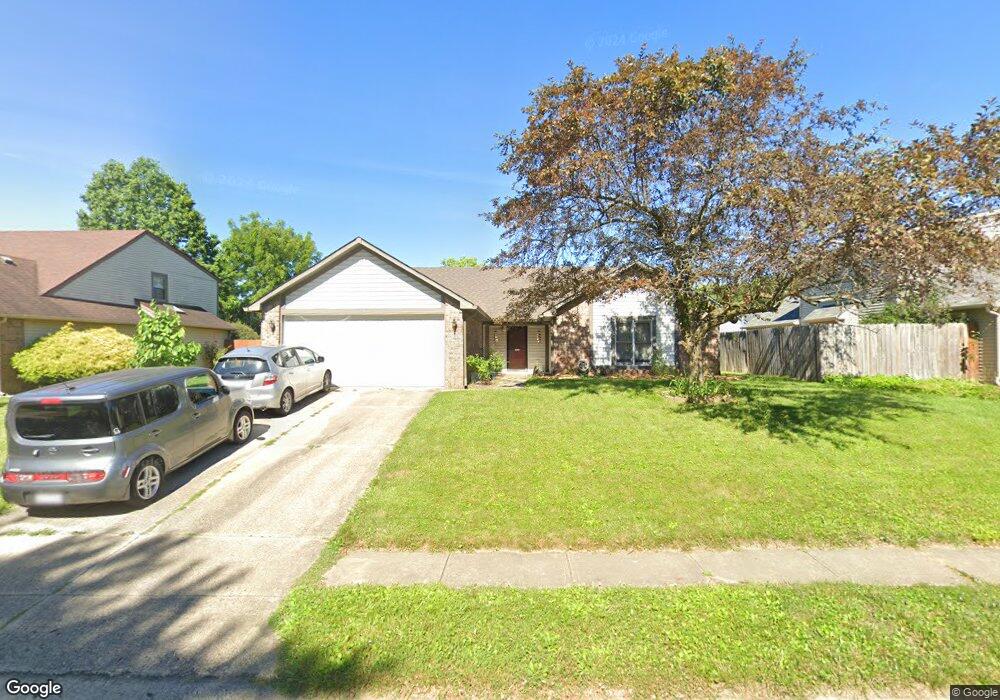
926 Jonathan Dr Plainfield, IN 46168
Estimated Value: $286,040 - $304,000
3
Beds
2
Baths
1,536
Sq Ft
$194/Sq Ft
Est. Value
About This Home
This home is located at 926 Jonathan Dr, Plainfield, IN 46168 and is currently estimated at $298,510, approximately $194 per square foot. 926 Jonathan Dr is a home located in Hendricks County with nearby schools including Van Buren Elementary School, Plainfield Community Middle School, and Plainfield High School.
Ownership History
Date
Name
Owned For
Owner Type
Purchase Details
Closed on
Jul 12, 2017
Sold by
Doolin Renee C
Bought by
Doolin Andrew E
Current Estimated Value
Purchase Details
Closed on
Jan 26, 2012
Sold by
Doolin Andrew E
Bought by
Doolin Andrew E and Doolin Renee C
Home Financials for this Owner
Home Financials are based on the most recent Mortgage that was taken out on this home.
Original Mortgage
$118,778
Outstanding Balance
$79,926
Interest Rate
3.9%
Mortgage Type
FHA
Estimated Equity
$218,584
Purchase Details
Closed on
Mar 9, 2009
Sold by
Depasse Ryan M and Depasse Maria G
Bought by
Doolin Andrew E
Home Financials for this Owner
Home Financials are based on the most recent Mortgage that was taken out on this home.
Original Mortgage
$122,735
Interest Rate
5.2%
Mortgage Type
FHA
Create a Home Valuation Report for This Property
The Home Valuation Report is an in-depth analysis detailing your home's value as well as a comparison with similar homes in the area
Home Values in the Area
Average Home Value in this Area
Purchase History
| Date | Buyer | Sale Price | Title Company |
|---|---|---|---|
| Doolin Andrew E | -- | Attorneys Title | |
| Doolin Andrew E | -- | None Available | |
| Doolin Andrew E | -- | Ctic Avon |
Source: Public Records
Mortgage History
| Date | Status | Borrower | Loan Amount |
|---|---|---|---|
| Open | Doolin Andrew E | $118,778 | |
| Closed | Doolin Andrew E | $122,735 |
Source: Public Records
Tax History
| Year | Tax Paid | Tax Assessment Tax Assessment Total Assessment is a certain percentage of the fair market value that is determined by local assessors to be the total taxable value of land and additions on the property. | Land | Improvement |
|---|---|---|---|---|
| 2025 | $1,931 | $230,700 | $54,000 | $176,700 |
| 2024 | $1,931 | $218,900 | $31,200 | $187,700 |
| 2023 | $1,795 | $208,700 | $29,600 | $179,100 |
| 2022 | $1,839 | $198,600 | $28,200 | $170,400 |
| 2021 | $1,616 | $177,600 | $27,200 | $150,400 |
| 2020 | $1,467 | $165,500 | $27,200 | $138,300 |
| 2019 | $1,335 | $156,400 | $25,300 | $131,100 |
| 2018 | $1,335 | $153,200 | $25,300 | $127,900 |
| 2017 | $1,260 | $142,800 | $24,400 | $118,400 |
| 2016 | $1,185 | $137,500 | $24,400 | $113,100 |
| 2014 | $1,125 | $130,500 | $23,000 | $107,500 |
Source: Public Records
Map
Nearby Homes
- 911 Gary Dr
- 800 Walton Dr
- 1713 Sycamore Dr
- 2668 Marjorie Ln
- 324 Lawndale Dr
- 942 Highlander Dr
- 228 Shaw St
- 1771 Quaker Blvd
- 2394 Eagle Ave
- 2198 Galleone Way
- 7683 Fairwood Blvd
- 5565 Crystal Bay West Dr
- 1849 Crystal Bay East Dr
- 5906 Juna Ave
- 5922 Juna Ave
- 5907 Farwell Ave
- 5926 Juna Ave
- 5914 Juna Ave
- 1710 Beechwood Dr
- 408 Linden Ln
- 926 Johnathan Dr
- 922 Jonathan Dr
- 930 Jonathan Dr
- 930 Johnathan Dr
- 922 Johnathan Dr
- 901 Johnathan Dr
- 905 Brookside Ln
- 934 Johnathan Dr
- 934 Jonathan Dr
- 909 Brookside Ln
- 927 Jonathan Dr
- 931 Jonathan Dr
- 927 Johnathan Dr
- 931 Johnathan Dr
- 913 Brookside Ln
- 923 Johnathan Dr
- 935 Jonathan Dr
- 938 Johnathan Dr
- 908 Jonathan Dr
- 912 Johnathan Dr
Your Personal Tour Guide
Ask me questions while you tour the home.