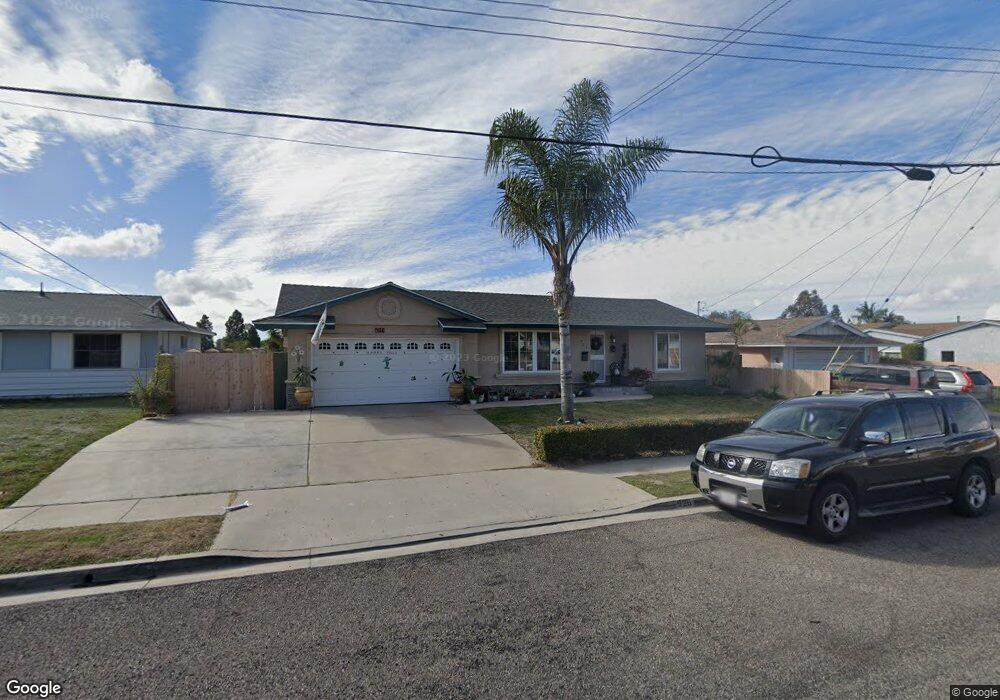
926 Wayne Ave Chula Vista, CA 91913
Eastlake NeighborhoodEstimated Value: $873,000 - $1,032,000
3
Beds
2
Baths
1,260
Sq Ft
$747/Sq Ft
Est. Value
About This Home
This home is located at 926 Wayne Ave, Chula Vista, CA 91913 and is currently estimated at $940,830, approximately $746 per square foot. 926 Wayne Ave is a home located in San Diego County with nearby schools including Burton C. Tiffany Elementary School, Bonita Vista Middle School, and Bonita Vista Senior High School.
Ownership History
Date
Name
Owned For
Owner Type
Purchase Details
Closed on
Sep 29, 2024
Sold by
Burgos Benny and Burgos Ruth
Bought by
Burgos Living Trust and Burgos
Current Estimated Value
Purchase Details
Closed on
Jul 11, 2014
Sold by
Burgos Ruth and Sifuentes Ruth
Bought by
Burgos Ruth and Burgos Benny
Home Financials for this Owner
Home Financials are based on the most recent Mortgage that was taken out on this home.
Original Mortgage
$266,000
Interest Rate
3.19%
Mortgage Type
New Conventional
Purchase Details
Closed on
Mar 8, 2002
Sold by
Salas Michael F and Salas Rochelle M
Bought by
Sifuentes Ruth
Home Financials for this Owner
Home Financials are based on the most recent Mortgage that was taken out on this home.
Original Mortgage
$279,375
Interest Rate
6.78%
Mortgage Type
Stand Alone First
Purchase Details
Closed on
Jul 2, 1990
Purchase Details
Closed on
Apr 21, 1988
Create a Home Valuation Report for This Property
The Home Valuation Report is an in-depth analysis detailing your home's value as well as a comparison with similar homes in the area
Home Values in the Area
Average Home Value in this Area
Purchase History
| Date | Buyer | Sale Price | Title Company |
|---|---|---|---|
| Burgos Living Trust | -- | None Listed On Document | |
| Burgos Ruth | -- | Chicago Title Company | |
| Sifuentes Ruth | $298,000 | Fidelity National Title | |
| Sifuentes Ruth | -- | Fidelity National Title | |
| -- | $195,000 | -- | |
| -- | $146,000 | -- |
Source: Public Records
Mortgage History
| Date | Status | Borrower | Loan Amount |
|---|---|---|---|
| Previous Owner | Burgos Ruth | $266,000 | |
| Previous Owner | Sifuentes Ruth | $279,375 |
Source: Public Records
Tax History
| Year | Tax Paid | Tax Assessment Tax Assessment Total Assessment is a certain percentage of the fair market value that is determined by local assessors to be the total taxable value of land and additions on the property. | Land | Improvement |
|---|---|---|---|---|
| 2025 | $5,007 | $440,220 | $192,042 | $248,178 |
| 2024 | $5,007 | $431,589 | $188,277 | $243,312 |
| 2023 | $4,937 | $423,128 | $184,586 | $238,542 |
| 2022 | $4,794 | $414,832 | $180,967 | $233,865 |
| 2021 | $4,682 | $406,699 | $177,419 | $229,280 |
| 2020 | $4,570 | $402,530 | $175,600 | $226,930 |
| 2019 | $4,451 | $394,638 | $172,157 | $222,481 |
| 2018 | $4,381 | $386,901 | $168,782 | $218,119 |
| 2017 | $13 | $379,316 | $165,473 | $213,843 |
| 2016 | $4,187 | $371,879 | $162,229 | $209,650 |
| 2015 | $4,127 | $366,294 | $159,793 | $206,501 |
| 2014 | $4,057 | $359,119 | $156,663 | $202,456 |
Source: Public Records
Map
Nearby Homes
- 1753 Ithaca St
- 1056 Strawberry Valley Dr
- 1532 Apache Dr Unit D
- 1164 Benecia Ct
- 1727 Long Ridge St
- 1929 Duke St
- 1777 Clover Tree Ct
- 1858 Harrils Mill Ave
- 1925 Otay Lakes Rd Unit 148
- 1925 Otay Lakes Rd Unit 43
- 1925 Otay Lakes Rd Unit 71
- 1925 Otay Lakes Rd Unit 1
- 1925 Otay Lakes Rd Unit 167
- 1925 Otay Lakes Rd Unit 171
- 1925 Otay Lakes Rd Unit 78
- 1781 Camino Strava Unit 1
- 1774 Camino Strava
- 1465 Summit Dr
- 1415 Summit Dr
- 1386 Serena Cir Unit 1
Your Personal Tour Guide
Ask me questions while you tour the home.