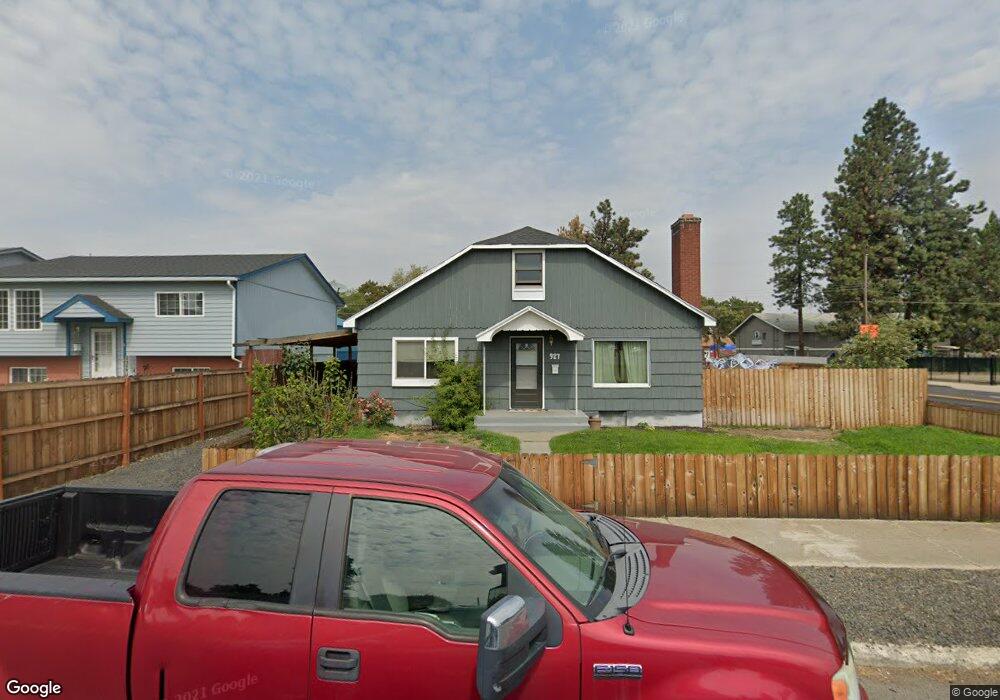
927 E Sanson Ave Spokane, WA 99207
Nevada Lidgerwood NeighborhoodEstimated Value: $321,632 - $363,000
4
Beds
2
Baths
3,043
Sq Ft
$115/Sq Ft
Est. Value
About This Home
This home is located at 927 E Sanson Ave, Spokane, WA 99207 and is currently estimated at $349,908, approximately $114 per square foot. 927 E Sanson Ave is a home located in Spokane County with nearby schools including Lidgerwood Elementary School, Garry Middle School, and Rogers High School.
Ownership History
Date
Name
Owned For
Owner Type
Purchase Details
Closed on
Oct 5, 2009
Sold by
Brown Jeffrey A and Brown Nanette
Bought by
Dokken Steven M and Dokken Danielle L
Current Estimated Value
Home Financials for this Owner
Home Financials are based on the most recent Mortgage that was taken out on this home.
Original Mortgage
$142,373
Outstanding Balance
$92,682
Interest Rate
5.02%
Mortgage Type
FHA
Estimated Equity
$257,226
Purchase Details
Closed on
May 15, 2007
Sold by
Lewis Michael E and Whitten Nancy L
Bought by
Brown Jeff and Brown Nanette
Purchase Details
Closed on
Oct 21, 2005
Sold by
Moran Richard A and Moran Christine M
Bought by
Lewis Michael E and Whitten Nancy L
Home Financials for this Owner
Home Financials are based on the most recent Mortgage that was taken out on this home.
Original Mortgage
$123,750
Interest Rate
6%
Mortgage Type
Fannie Mae Freddie Mac
Create a Home Valuation Report for This Property
The Home Valuation Report is an in-depth analysis detailing your home's value as well as a comparison with similar homes in the area
Home Values in the Area
Average Home Value in this Area
Purchase History
| Date | Buyer | Sale Price | Title Company |
|---|---|---|---|
| Dokken Steven M | $145,000 | Inland Professional Title Ll | |
| Brown Jeff | $134,147 | Transnation Title Ins Co | |
| Lewis Michael E | $123,750 | Pacific Nw Title |
Source: Public Records
Mortgage History
| Date | Status | Borrower | Loan Amount |
|---|---|---|---|
| Open | Dokken Steven M | $142,373 | |
| Previous Owner | Lewis Michael E | $123,750 |
Source: Public Records
Tax History
| Year | Tax Paid | Tax Assessment Tax Assessment Total Assessment is a certain percentage of the fair market value that is determined by local assessors to be the total taxable value of land and additions on the property. | Land | Improvement |
|---|---|---|---|---|
| 2025 | $3,057 | $311,700 | $55,000 | $256,700 |
| 2024 | $3,057 | $307,800 | $55,000 | $252,800 |
| 2023 | $3,009 | $307,400 | $46,000 | $261,400 |
| 2022 | $2,466 | $307,400 | $46,000 | $261,400 |
| 2021 | $2,166 | $181,700 | $23,000 | $158,700 |
| 2020 | $1,962 | $158,500 | $21,000 | $137,500 |
| 2019 | $1,743 | $145,600 | $16,500 | $129,100 |
| 2018 | $1,710 | $122,700 | $15,000 | $107,700 |
| 2017 | $1,471 | $107,400 | $15,000 | $92,400 |
| 2016 | $1,422 | $101,600 | $15,000 | $86,600 |
| 2015 | $1,476 | $103,200 | $18,000 | $85,200 |
| 2014 | -- | $110,300 | $18,000 | $92,300 |
| 2013 | -- | $0 | $0 | $0 |
Source: Public Records
Map
Nearby Homes
- 921 E Everett Ave Unit 923 E Everett Ave
- 923 E Everett Ave Unit 921 E Everett Ave
- 824 E North Ave
- 1030 E Sanson Ave
- 1102 E North Ave
- 1113 E Rowan Ave
- 820 E Crown Ave
- 824 E Crown Ave
- 727 E Crown Ave
- 914 E Joseph Ave
- 1023 E Queen Ave
- 1024 E Queen Ave
- 718 E Queen Ave
- 1027 E Wabash Ave
- 1428 E North Ave
- 1411 E Nebraska Ave
- 518 E Dave Ct
- 604 E Columbia Ave
- 1517 E Sanson Ave
- 513 E Dave Ct
- 921 E Sanson Ave
- 915 E Sanson Ave
- 911 E Sanson Ave
- 926 E North Ave
- 920 E North Ave
- 922 E North Ave
- 916 E North Ave
- 5323 N Nevada St
- 920 E Sanson Ave
- 905 E Sanson Ave
- 1011 E Sanson Ave
- 912 E North Ave
- 5320 N Nevada St
- 912 E Sanson Ave
- 910 E North Ave
- 1012 E North Ave
- 1006 E Sanson Ave
- 1015 E Sanson Ave
- 1010 E Sanson Ave
- 902 E North Ave
Your Personal Tour Guide
Ask me questions while you tour the home.