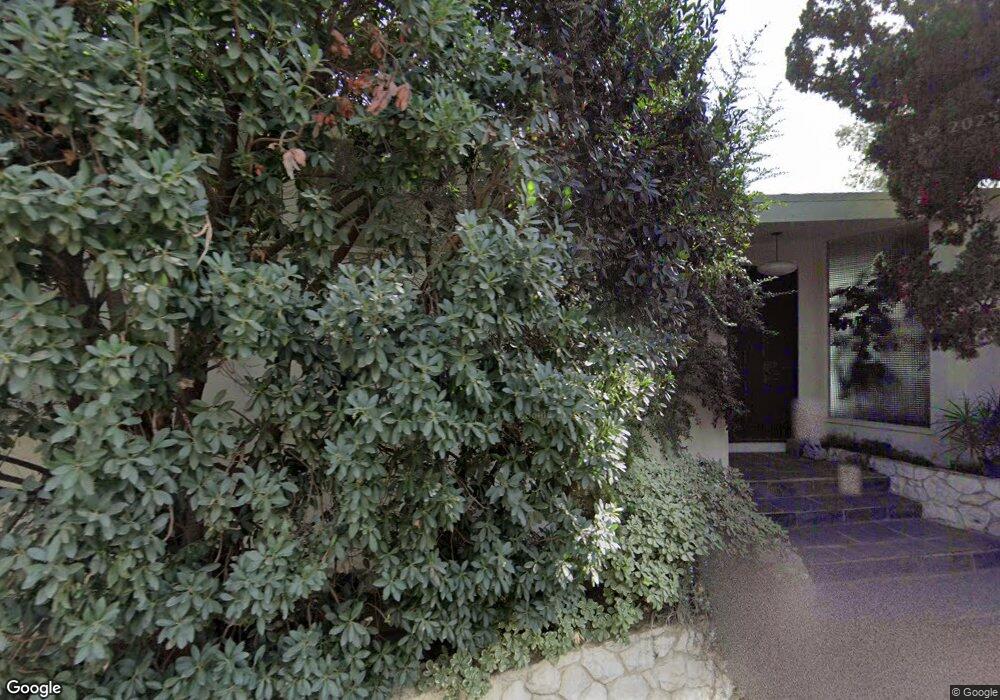
9276 Flicker Way Los Angeles, CA 90069
Hollywood Hills West NeighborhoodEstimated Value: $1,164,000 - $2,292,000
2
Beds
3
Baths
1,691
Sq Ft
$1,154/Sq Ft
Est. Value
About This Home
This home is located at 9276 Flicker Way, Los Angeles, CA 90069 and is currently estimated at $1,950,922, approximately $1,153 per square foot. 9276 Flicker Way is a home located in Los Angeles County with nearby schools including West Hollywood Elementary School, Hubert Howe Bancroft Middle School, and Fairfax High School.
Ownership History
Date
Name
Owned For
Owner Type
Purchase Details
Closed on
May 25, 2016
Sold by
Matuszak Mark L
Bought by
Matuszak Mark L and The Mark L Matuszak Trust
Current Estimated Value
Purchase Details
Closed on
Oct 25, 2012
Sold by
Matuszak Mark L and Mark L Matuszak Trust
Bought by
Matuszak Mark L
Home Financials for this Owner
Home Financials are based on the most recent Mortgage that was taken out on this home.
Original Mortgage
$935,000
Outstanding Balance
$624,631
Interest Rate
2.7%
Mortgage Type
New Conventional
Estimated Equity
$1,326,291
Purchase Details
Closed on
Aug 31, 2000
Sold by
Alpert Sidney R and Estate Of Mac R Rhode
Bought by
Matuszak Mark
Home Financials for this Owner
Home Financials are based on the most recent Mortgage that was taken out on this home.
Original Mortgage
$435,967
Interest Rate
8.89%
Create a Home Valuation Report for This Property
The Home Valuation Report is an in-depth analysis detailing your home's value as well as a comparison with similar homes in the area
Home Values in the Area
Average Home Value in this Area
Purchase History
| Date | Buyer | Sale Price | Title Company |
|---|---|---|---|
| Matuszak Mark L | -- | None Available | |
| Matuszak Mark L | -- | Lsi | |
| Matuszak Mark | $485,000 | Provident Title |
Source: Public Records
Mortgage History
| Date | Status | Borrower | Loan Amount |
|---|---|---|---|
| Open | Matuszak Mark L | $935,000 | |
| Closed | Matuszak Mark | $435,967 |
Source: Public Records
Tax History Compared to Growth
Tax History
| Year | Tax Paid | Tax Assessment Tax Assessment Total Assessment is a certain percentage of the fair market value that is determined by local assessors to be the total taxable value of land and additions on the property. | Land | Improvement |
|---|---|---|---|---|
| 2025 | $11,316 | $928,195 | $706,700 | $221,495 |
| 2024 | $11,316 | $909,996 | $692,844 | $217,152 |
| 2023 | $11,103 | $892,154 | $679,259 | $212,895 |
| 2022 | $10,620 | $874,662 | $665,941 | $208,721 |
| 2021 | $10,487 | $857,513 | $652,884 | $204,629 |
| 2019 | $10,111 | $832,080 | $633,520 | $198,560 |
| 2018 | $10,052 | $815,766 | $621,099 | $194,667 |
| 2016 | $9,580 | $784,090 | $596,982 | $187,108 |
| 2015 | $9,441 | $772,313 | $588,015 | $184,298 |
| 2014 | $9,477 | $757,185 | $576,497 | $180,688 |
Source: Public Records
Map
Nearby Homes
- 1395 N Doheny Dr
- 9405 Sierra Mar Place
- 9410 Sierra Mar Place
- 9199 Thrasher Ave
- 1609 Magnetic Terrace
- 9356 Sierra Mar Dr
- 1340 Sierra Alta Way
- 9443 Sierra Mar Place
- 1307 N Doheny Dr
- 9277 Thrush Way
- 9400 Sierra Mar Dr
- 1046 N Hillcrest Rd
- 1457 Blue Jay Way
- 1108 Wallace Ridge
- 9126 Cordell Dr
- 9265 Robin Dr
- 1016 N Hillcrest Rd
- 9259 Robin Dr
- 9006 Thrasher Ave
- 9146 St Ives Dr
- 1417 Bluebird Ave
- 1409 Bluebird Ave
- 9283 Flicker Way
- 9275 Flicker Way
- 9291 Flicker Way
- 9300 Flicker Way
- 9300 Flicker Way
- 9271 Flicker Way
- 1405 Bluebird Ave
- 1437 Bluebird Ave
- 9301 Flicker Way
- 1401 N Doheny Dr
- 1416 Bluebird Ave
- 1378 Bobolink Place
- 9268 W Flicker Place
- 9305 Flicker Way
- 9271 Flicker Place
- 9222 Flicker Way
- 1409 N Doheny Dr
- 9237 Flicker Way