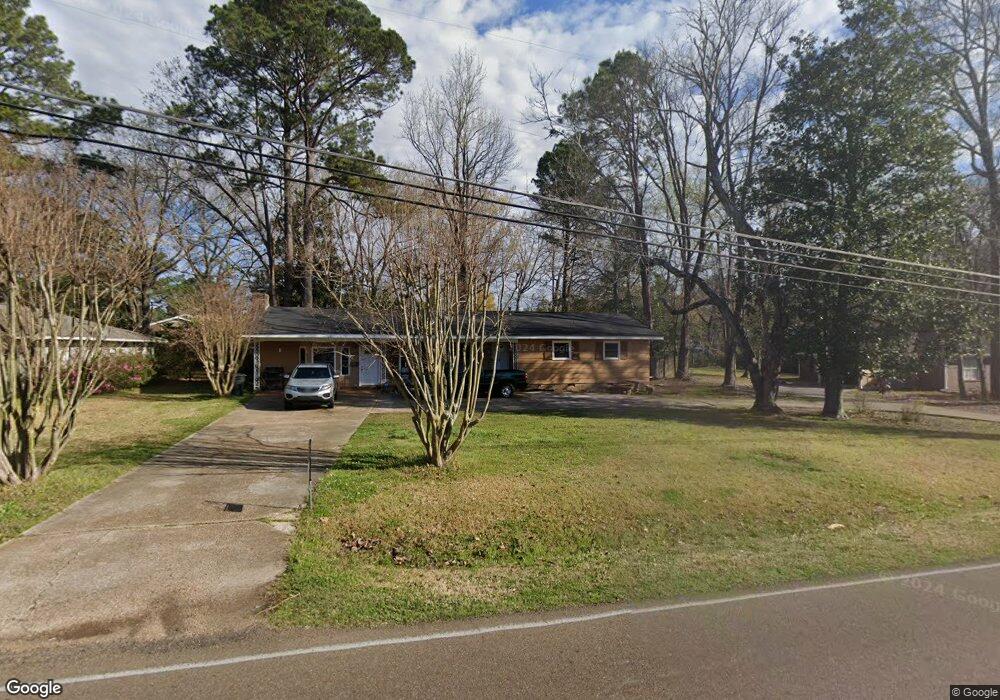
928 Adkins Blvd Jackson, MS 39211
North Jackson NeighborhoodEstimated Value: $152,000 - $167,000
3
Beds
3
Baths
1,814
Sq Ft
$88/Sq Ft
Est. Value
About This Home
This home is located at 928 Adkins Blvd, Jackson, MS 39211 and is currently estimated at $160,089, approximately $88 per square foot. 928 Adkins Blvd is a home located in Hinds County with nearby schools including Spann Elementary School, Murrah High School, and Jackson Academy.
Ownership History
Date
Name
Owned For
Owner Type
Purchase Details
Closed on
Feb 21, 2020
Sold by
Richardson John
Bought by
Coleman Sandra
Current Estimated Value
Create a Home Valuation Report for This Property
The Home Valuation Report is an in-depth analysis detailing your home's value as well as a comparison with similar homes in the area
Home Values in the Area
Average Home Value in this Area
Purchase History
| Date | Buyer | Sale Price | Title Company |
|---|---|---|---|
| Coleman Sandra | -- | None Available |
Source: Public Records
Tax History
| Year | Tax Paid | Tax Assessment Tax Assessment Total Assessment is a certain percentage of the fair market value that is determined by local assessors to be the total taxable value of land and additions on the property. | Land | Improvement |
|---|---|---|---|---|
| 2025 | $305 | $9,278 | $4,000 | $5,278 |
| 2024 | $305 | $9,079 | $4,000 | $5,079 |
| 2023 | $305 | $9,079 | $4,000 | $5,079 |
| 2022 | $1,747 | $9,079 | $4,000 | $5,079 |
| 2021 | $269 | $8,896 | $4,000 | $4,896 |
| 2020 | $2,540 | $13,278 | $6,000 | $7,278 |
| 2019 | $2,542 | $13,278 | $6,000 | $7,278 |
| 2018 | $2,514 | $13,278 | $6,000 | $7,278 |
| 2017 | $2,449 | $13,278 | $6,000 | $7,278 |
| 2016 | $2,449 | $13,278 | $6,000 | $7,278 |
| 2015 | $2,349 | $13,119 | $6,000 | $7,119 |
| 2014 | $2,346 | $13,119 | $6,000 | $7,119 |
Source: Public Records
Map
Nearby Homes
- 865 Fairfax Cir
- 1012 Auburn Dr
- 1237 Springdale Dr
- 1204 Deerfield Ln
- 5636 Ridgewood Rd
- 1042 Bayridge Dr
- 1036 Briarfield Rd
- 945 Park Ln
- 1026 Briarwood Dr
- 5520 Ridgewood Rd
- 223 S Park Dr
- 5379 Fairway St
- 5900 Kristen Dr
- 5447 Wayneland Dr
- 5422 River Thames Rd
- 5212 Hialeah Dr
- 1422 Mossline Dr
- 5376 Kaywood Dr
- 5235 Hialeah Dr
- 1431 Tracewood Dr
- 936 Adkins Blvd
- 920 Adkins Blvd
- 0 Adkins Blvd
- 944 Adkins Blvd
- 912 Adkins Blvd
- 919 Adkins Blvd
- 927 Adkins Blvd
- 904 Adkins Blvd
- 935 Adkins Blvd
- 802 Fairfax Cir
- 1006 Adkins Blvd
- 828 Adkins Blvd
- 1005 Adkins Blvd
- 814 Fairfax Cir
- 1131 Springdale Dr
- 820 Fairfax Cir
- 1014 Adkins Blvd
- 826 Fairfax Cir
- 844 Fairfax Cir
- 1137 Springdale Dr
Your Personal Tour Guide
Ask me questions while you tour the home.