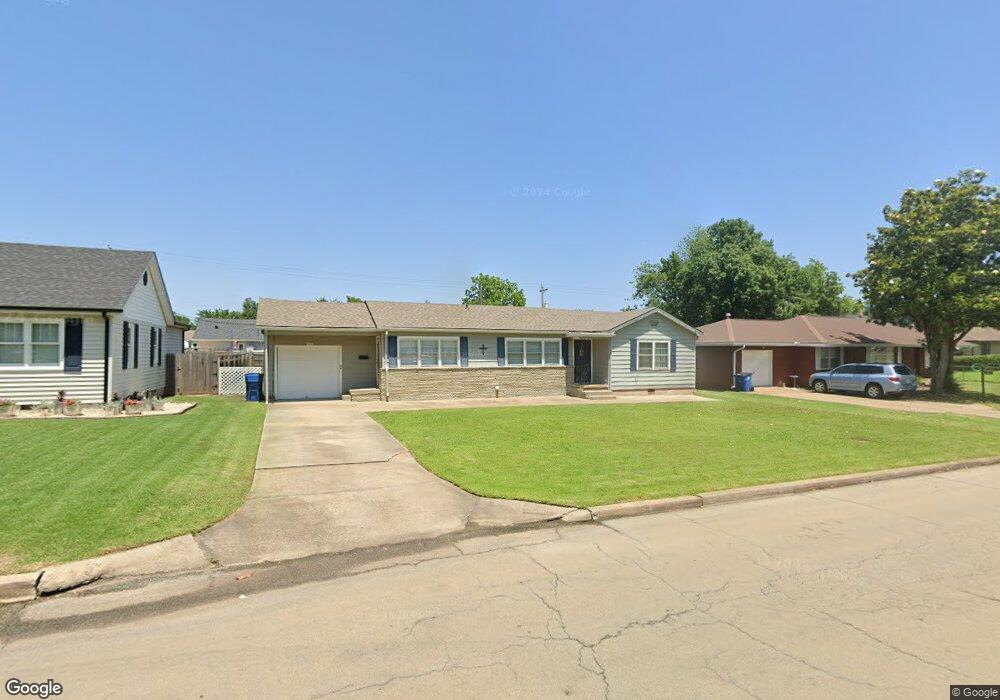
928 E Cherry St Cushing, OK 74023
Estimated Value: $83,000 - $120,000
3
Beds
2
Baths
1,095
Sq Ft
$88/Sq Ft
Est. Value
About This Home
This home is located at 928 E Cherry St, Cushing, OK 74023 and is currently estimated at $96,782, approximately $88 per square foot. 928 E Cherry St is a home located in Payne County with nearby schools including Cushing Upper Elementary School, Cushing Lower Elementary School, and Cushing High School.
Ownership History
Date
Name
Owned For
Owner Type
Purchase Details
Closed on
Dec 6, 2011
Sold by
Flatt Charles R and Flatt Shirley
Bought by
Jerry Rogers Operating Llc
Current Estimated Value
Home Financials for this Owner
Home Financials are based on the most recent Mortgage that was taken out on this home.
Original Mortgage
$33,750
Outstanding Balance
$22,941
Interest Rate
4.03%
Mortgage Type
Future Advance Clause Open End Mortgage
Estimated Equity
$73,841
Create a Home Valuation Report for This Property
The Home Valuation Report is an in-depth analysis detailing your home's value as well as a comparison with similar homes in the area
Purchase History
| Date | Buyer | Sale Price | Title Company |
|---|---|---|---|
| Jerry Rogers Operating Llc | $35,000 | None Available |
Source: Public Records
Mortgage History
| Date | Status | Borrower | Loan Amount |
|---|---|---|---|
| Open | Jerry Rogers Operating Llc | $33,750 |
Source: Public Records
Tax History
| Year | Tax Paid | Tax Assessment Tax Assessment Total Assessment is a certain percentage of the fair market value that is determined by local assessors to be the total taxable value of land and additions on the property. | Land | Improvement |
|---|---|---|---|---|
| 2025 | $535 | $5,745 | $474 | $5,271 |
| 2024 | $487 | $5,745 | $474 | $5,271 |
| 2023 | $487 | $5,472 | $826 | $4,646 |
| 2022 | $459 | $5,386 | $813 | $4,573 |
| 2021 | $426 | $5,130 | $826 | $4,304 |
| 2020 | $448 | $5,472 | $826 | $4,646 |
| 2019 | $506 | $5,919 | $827 | $5,092 |
| 2018 | $491 | $5,919 | $827 | $5,092 |
| 2017 | $487 | $5,919 | $827 | $5,092 |
| 2016 | $500 | $5,919 | $827 | $5,092 |
| 2015 | $569 | $6,566 | $889 | $5,677 |
| 2014 | -- | $6,566 | $889 | $5,677 |
Source: Public Records
Map
Nearby Homes
- 1002 E Cherry St
- 919 E 2nd St
- 915 E Oak St
- 112 S Highland Ave
- 732 E Broadway St
- 1003 E 4th St
- 933 E Maple St
- 843 E 4th St
- 708 E Broadway St
- 724 E Moses St
- 616 E Cherry St
- 1217 E Cherry St
- 612 E 2nd St
- 1224 E Cherry St
- 822 E 6th St
- 1301 E Ash St
- 835 S Thompson Place
- 1318 E Oak St
- 508 S Michigan Ave
- 1107 E 8th St
- 922 E Cherry St
- 934 E Cherry St
- 916 E Cherry St
- 927 E Broadway St
- 925 E Broadway St
- 940 E Cherry St
- 935 E Broadway St
- 935 E Cherry St
- E E Cherry St
- 0 E Cherry St
- 921 E Broadway St
- 923 E Cherry St
- 910 E Cherry St
- 939 E Broadway St
- 913 E Cherry St
- 902 E Cherry St
- 901 E Broadway St
- 907 E Cherry St
- 901 E Cherry St
- 1003 E Broadway St
Your Personal Tour Guide
Ask me questions while you tour the home.