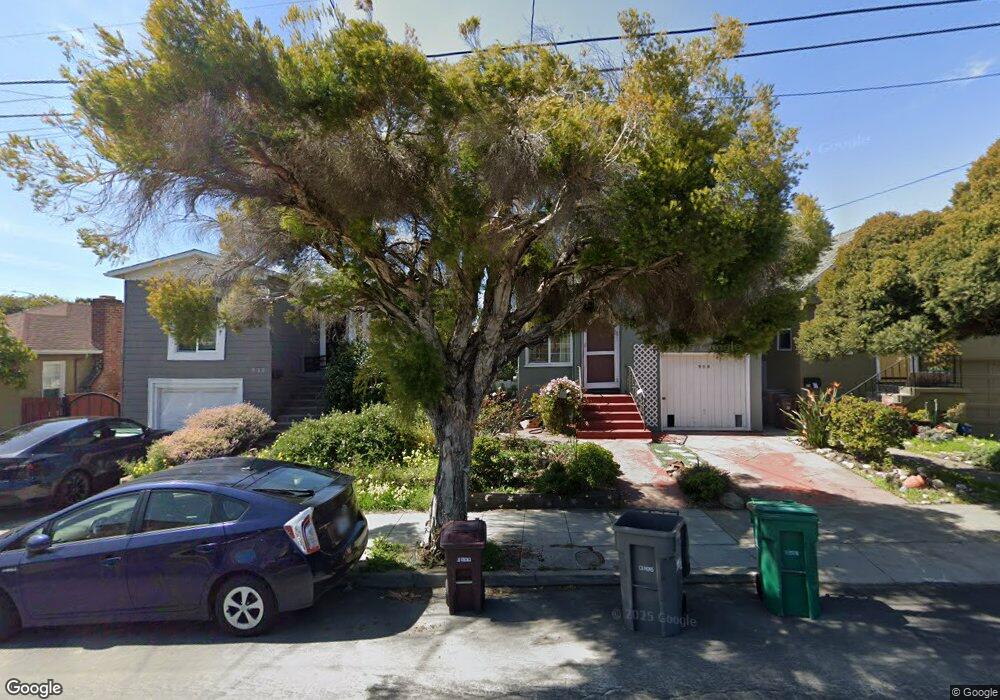
928 Pierce St Albany, CA 94706
Estimated Value: $963,125 - $1,214,000
2
Beds
1
Bath
1,027
Sq Ft
$1,077/Sq Ft
Est. Value
About This Home
This home is located at 928 Pierce St, Albany, CA 94706 and is currently estimated at $1,106,031, approximately $1,076 per square foot. 928 Pierce St is a home located in Alameda County with nearby schools including Albany Middle School, Albany High School, and Tilden Preparatory School - Albany.
Ownership History
Date
Name
Owned For
Owner Type
Purchase Details
Closed on
Jul 10, 2024
Sold by
Simmons Jennifer
Bought by
Jennifer Simmons Trust and Simmons
Current Estimated Value
Purchase Details
Closed on
Dec 7, 2023
Sold by
Pilch John Nick
Bought by
Simmons Jennifer
Purchase Details
Closed on
Oct 1, 2009
Sold by
Simmons Jennifer and The Jennifer Simmons Trust
Bought by
Pilch John Nick and Simmons Jennifer
Purchase Details
Closed on
Jan 2, 2003
Sold by
Simmons Jennifer
Bought by
Simmons Jennifer and The Jennifer Simmons Trust
Purchase Details
Closed on
Oct 13, 1997
Sold by
Roller Helen G Trust and Judith
Bought by
Simmons Jennifer
Home Financials for this Owner
Home Financials are based on the most recent Mortgage that was taken out on this home.
Original Mortgage
$122,400
Interest Rate
7.49%
Create a Home Valuation Report for This Property
The Home Valuation Report is an in-depth analysis detailing your home's value as well as a comparison with similar homes in the area
Home Values in the Area
Average Home Value in this Area
Purchase History
| Date | Buyer | Sale Price | Title Company |
|---|---|---|---|
| Jennifer Simmons Trust | -- | None Listed On Document | |
| Simmons Jennifer | -- | None Listed On Document | |
| Pilch John Nick | -- | Placer Title Company | |
| Simmons Jennifer | -- | -- | |
| Simmons Jennifer | $153,000 | Nortwestern Title Company |
Source: Public Records
Mortgage History
| Date | Status | Borrower | Loan Amount |
|---|---|---|---|
| Previous Owner | Simmons Jennifer | $122,400 |
Source: Public Records
Tax History Compared to Growth
Tax History
| Year | Tax Paid | Tax Assessment Tax Assessment Total Assessment is a certain percentage of the fair market value that is determined by local assessors to be the total taxable value of land and additions on the property. | Land | Improvement |
|---|---|---|---|---|
| 2025 | $5,774 | $217,628 | $67,060 | $157,568 |
| 2024 | $5,774 | $213,225 | $65,745 | $154,480 |
| 2023 | $5,625 | $208,907 | $64,456 | $151,451 |
| 2022 | $5,432 | $204,673 | $63,192 | $148,481 |
| 2021 | $5,329 | $200,523 | $61,953 | $145,570 |
| 2020 | $5,169 | $205,396 | $61,318 | $144,078 |
| 2019 | $5,046 | $201,370 | $60,116 | $141,254 |
| 2018 | $4,914 | $197,423 | $58,938 | $138,485 |
| 2017 | $4,787 | $193,552 | $57,782 | $135,770 |
| 2016 | $4,580 | $189,758 | $56,650 | $133,108 |
| 2015 | $4,364 | $186,908 | $55,799 | $131,109 |
| 2014 | $4,244 | $183,247 | $54,706 | $128,541 |
Source: Public Records
Map
Nearby Homes
- 715 Buchanan St
- 812 Washington Ave
- 835 Solano Ave
- 785 Taft Ave Unit 10
- 935 Hillside Ave
- 704 Madison St
- 555 Pierce St Unit 733D
- 555 Pierce St Unit 1534
- 555 Pierce St Unit 203
- 555 Pierce St Unit 328
- 848 Stannage Ave Unit 11
- 545 Pierce St Unit 1206
- 1050 Kains Ave Unit 3(B1)
- 599 Jackson St
- 1038 Cornell Ave
- 1120 Garfield Ave
- 518 Kains Ave Unit 103
- 535 Pierce St Unit 3114
- 535 Pierce St Unit 1307
- 535 Pierce St Unit 2110