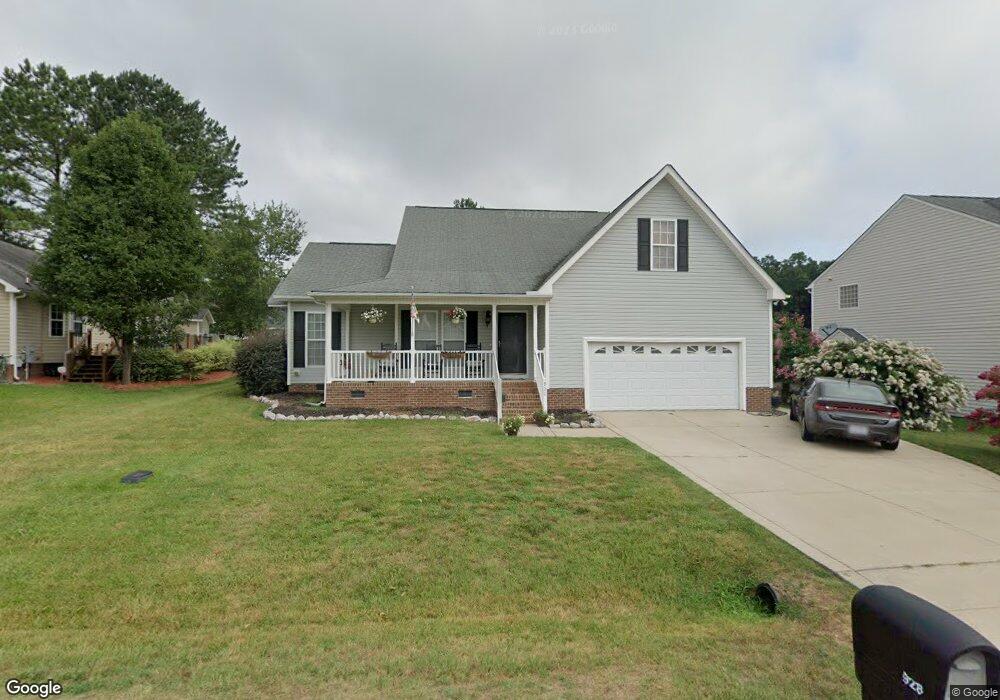
928 Troubadour Ln Knightdale, NC 27545
Shotwell NeighborhoodEstimated Value: $351,000 - $407,006
--
Bed
3
Baths
2,394
Sq Ft
$162/Sq Ft
Est. Value
About This Home
This home is located at 928 Troubadour Ln, Knightdale, NC 27545 and is currently estimated at $388,002, approximately $162 per square foot. 928 Troubadour Ln is a home located in Wake County with nearby schools including Lake Myra Elementary, Wendell Middle School, and East Wake High School.
Ownership History
Date
Name
Owned For
Owner Type
Purchase Details
Closed on
Dec 26, 2012
Sold by
Williams Sabrian L and Williams Sabrina
Bought by
Watford Sabrina
Current Estimated Value
Home Financials for this Owner
Home Financials are based on the most recent Mortgage that was taken out on this home.
Original Mortgage
$128,836
Outstanding Balance
$90,843
Interest Rate
3.75%
Mortgage Type
FHA
Estimated Equity
$297,159
Purchase Details
Closed on
Jul 31, 2003
Sold by
Rhc Construction & Realty Inc
Bought by
Williams Sabrina L
Home Financials for this Owner
Home Financials are based on the most recent Mortgage that was taken out on this home.
Original Mortgage
$159,737
Interest Rate
5.17%
Mortgage Type
FHA
Purchase Details
Closed on
Apr 10, 2003
Sold by
Kirby Marshburn Bldg Corp
Bought by
Rhc Construction & Realty Inc
Home Financials for this Owner
Home Financials are based on the most recent Mortgage that was taken out on this home.
Original Mortgage
$128,800
Interest Rate
5.62%
Create a Home Valuation Report for This Property
The Home Valuation Report is an in-depth analysis detailing your home's value as well as a comparison with similar homes in the area
Home Values in the Area
Average Home Value in this Area
Purchase History
| Date | Buyer | Sale Price | Title Company |
|---|---|---|---|
| Watford Sabrina | -- | None Available | |
| Williams Sabrina L | $161,000 | -- | |
| Rhc Construction & Realty Inc | $27,000 | -- |
Source: Public Records
Mortgage History
| Date | Status | Borrower | Loan Amount |
|---|---|---|---|
| Open | Watford Sabrina | $128,836 | |
| Previous Owner | Williams Sabrina L | $159,737 | |
| Previous Owner | Rhc Construction & Realty Inc | $128,800 |
Source: Public Records
Tax History Compared to Growth
Tax History
| Year | Tax Paid | Tax Assessment Tax Assessment Total Assessment is a certain percentage of the fair market value that is determined by local assessors to be the total taxable value of land and additions on the property. | Land | Improvement |
|---|---|---|---|---|
| 2025 | $2,789 | $432,865 | $110,000 | $322,865 |
| 2024 | $2,708 | $432,865 | $110,000 | $322,865 |
| 2023 | $2,059 | $261,508 | $45,000 | $216,508 |
| 2022 | $1,909 | $261,508 | $45,000 | $216,508 |
| 2021 | $1,858 | $261,508 | $45,000 | $216,508 |
| 2020 | $1,865 | $267,060 | $45,000 | $222,060 |
| 2019 | $1,585 | $191,581 | $28,500 | $163,081 |
| 2018 | $1,458 | $191,581 | $28,500 | $163,081 |
| 2017 | $1,382 | $191,581 | $28,500 | $163,081 |
| 2016 | $1,354 | $191,581 | $28,500 | $163,081 |
| 2015 | $1,357 | $192,478 | $30,000 | $162,478 |
| 2014 | $1,287 | $192,478 | $30,000 | $162,478 |
Source: Public Records
Map
Nearby Homes
- 5412 Swordsman Ct
- 532 Frampton Way
- 520 Folk Song Way
- 2201 Ballston Place
- 1112 Amber Acres Ln
- 5509 Sandy Run
- 1132 Amber Acres Ln
- 105 N Bend Dr
- 102 N Bend Dr
- 5329 Cottage Bluff Ln
- 528 Mailman Rd
- 1172 Cottonsprings Dr
- Manhattan Plan at Wendell Falls - Townhome Collection
- Park Ave Plan at Wendell Falls - Townhome Collection
- Greenwich Plan at Wendell Falls - Townhome Collection
- Paper Plan at Wendell Falls - Roshambo Collection
- Found a Dream Plan at Wendell Falls - Playlist Collection
- Tiebreaker Plan at Wendell Falls - Roshambo Collection
- Lincoln Plan at Wendell Falls - Townhome Collection
- Shoot Plan at Wendell Falls - Roshambo Collection
- 924 Troubadour Ln
- 5225 Nobleman Trail
- Lot 9 Troubadour Ln
- Lot 63 Troubadour Ln
- Lot 64 Troubadour Ln
- Lot 71 Troubadour Ln
- Lot 8 Troubadour Ln
- Lot 35 Troubadour Ln
- Lot 29 Troubadour Ln
- Lot 28 Troubadour Ln
- Lot 73 Troubadour Ln
- Lot 61 Troubadour Ln
- Lot 75 Troubadour Ln
- Lot 81 Troubadour Ln
- Lot 62 Troubadour Ln
- Lot 60 Troubadour Ln
- Lot 70 Troubadour Ln
- Lot 30 Troubadour Ln
- Lot 36 Troubadour Ln
- Lot 72 Troubadour Ln