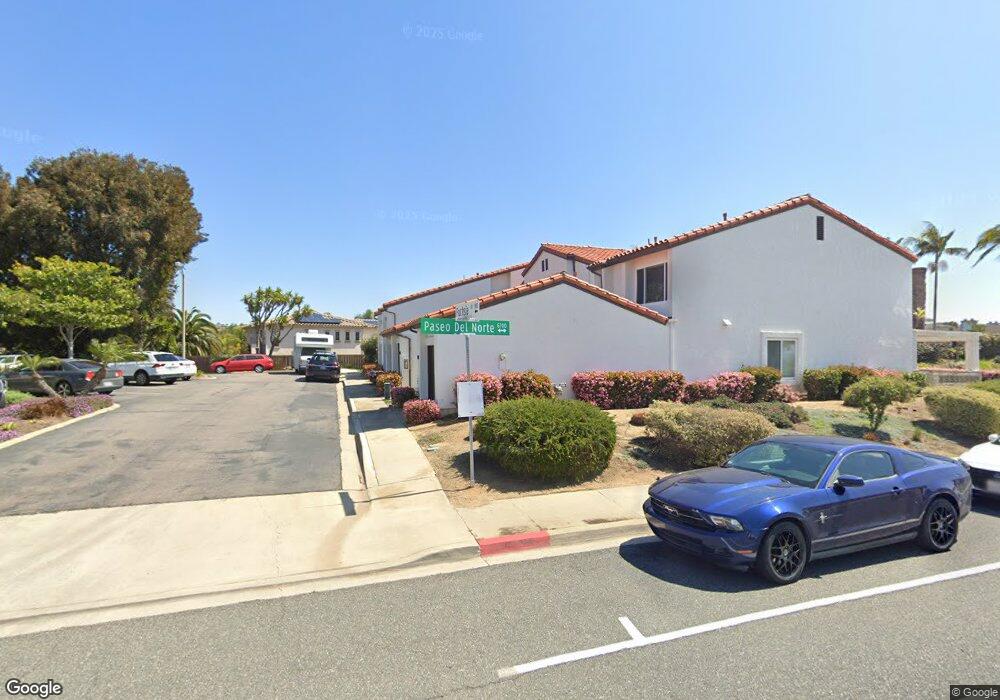
929 Fuchsia Ln Unit 4 Carlsbad, CA 92011
Poinsettia NeighborhoodEstimated Value: $970,000 - $1,123,000
3
Beds
3
Baths
1,502
Sq Ft
$692/Sq Ft
Est. Value
About This Home
This home is located at 929 Fuchsia Ln Unit 4, Carlsbad, CA 92011 and is currently estimated at $1,039,847, approximately $692 per square foot. 929 Fuchsia Ln Unit 4 is a home located in San Diego County with nearby schools including Pacific Rim Elementary, Aviara Oaks Middle, and Carlsbad High School.
Ownership History
Date
Name
Owned For
Owner Type
Purchase Details
Closed on
Nov 20, 2002
Sold by
Cardillo John A and Cardillo Glenda A
Bought by
Quirin Gregory J and Quirin Lea J
Current Estimated Value
Home Financials for this Owner
Home Financials are based on the most recent Mortgage that was taken out on this home.
Original Mortgage
$244,000
Outstanding Balance
$98,283
Interest Rate
5.5%
Mortgage Type
Purchase Money Mortgage
Estimated Equity
$941,564
Purchase Details
Closed on
Feb 12, 1999
Sold by
Pruett Ernest C and Pruett June D
Bought by
Cardillo John A and Ramsey Glenda A
Home Financials for this Owner
Home Financials are based on the most recent Mortgage that was taken out on this home.
Original Mortgage
$194,200
Interest Rate
6.91%
Mortgage Type
VA
Create a Home Valuation Report for This Property
The Home Valuation Report is an in-depth analysis detailing your home's value as well as a comparison with similar homes in the area
Home Values in the Area
Average Home Value in this Area
Purchase History
| Date | Buyer | Sale Price | Title Company |
|---|---|---|---|
| Quirin Gregory J | $305,000 | Commonwealth Land Title | |
| Cardillo John A | $189,500 | Fidelity National Title |
Source: Public Records
Mortgage History
| Date | Status | Borrower | Loan Amount |
|---|---|---|---|
| Open | Quirin Gregory J | $244,000 | |
| Previous Owner | Cardillo John A | $194,200 | |
| Closed | Quirin Gregory J | $61,000 |
Source: Public Records
Tax History Compared to Growth
Tax History
| Year | Tax Paid | Tax Assessment Tax Assessment Total Assessment is a certain percentage of the fair market value that is determined by local assessors to be the total taxable value of land and additions on the property. | Land | Improvement |
|---|---|---|---|---|
| 2025 | $4,595 | $441,717 | $325,863 | $115,854 |
| 2024 | $4,595 | $433,057 | $319,474 | $113,583 |
| 2023 | $4,570 | $424,566 | $313,210 | $111,356 |
| 2022 | $4,498 | $416,242 | $307,069 | $109,173 |
| 2021 | $4,463 | $408,082 | $301,049 | $107,033 |
| 2020 | $4,433 | $403,899 | $297,963 | $105,936 |
| 2019 | $4,352 | $395,980 | $292,121 | $103,859 |
| 2018 | $4,168 | $388,217 | $286,394 | $101,823 |
| 2017 | $90 | $380,606 | $280,779 | $99,827 |
| 2016 | $3,932 | $373,144 | $275,274 | $97,870 |
| 2015 | $3,915 | $367,540 | $271,140 | $96,400 |
| 2014 | $3,849 | $360,341 | $265,829 | $94,512 |
Source: Public Records
Map
Nearby Homes
- 839 Skysail Ave
- 874 Marigold Ct
- 803 Skysail Ave
- 909 Caminito Madrigal Unit B
- 911 Caminito Madrigal Unit E
- 6915 Pear Tree Dr
- 6951 Quiet Cove Dr
- 811 Caminito Del Sol
- 6925 Waters End Dr
- 6777 Lonicera St
- 7013 Lavender Way
- 609 Saltgrass Ave
- 6557 Coneflower Dr
- 6550 Ponto Dr Unit 14
- 6550 Ponto Dr Unit 76
- 6550 Ponto Dr Unit 78
- 6550 Ponto Dr Unit 135
- 6550 Ponto Dr Unit 110
- 6550 Ponto Dr Unit SPC 39
- 6550 Ponto Dr Unit 5
- 927 Fuchsia Ln
- 925 Fuchsia Ln
- 923 Fuchsia Ln
- 1030 Camino de Las Ondas
- 6798 Paseo Del Norte
- 1040 Camino de Las Ondas
- 1030 Camino de Las Ondas
- 1034 Camino de Las Ondas
- 1038 Camino de Las Ondas
- 1000 Camino de Las Ondas
- 1020 Camino de Las Ondas
- 928 Fuchsia Ln
- 926 Fuchsia Ln
- 924 Fuchsia Ln
- 922 Fuchsia Ln
- 6737 Whitesail St
- 920 Fuchsia Ln
- 1009 Lighthouse Rd
- 1001 Lands End Ct
- 6793 Heath Ct