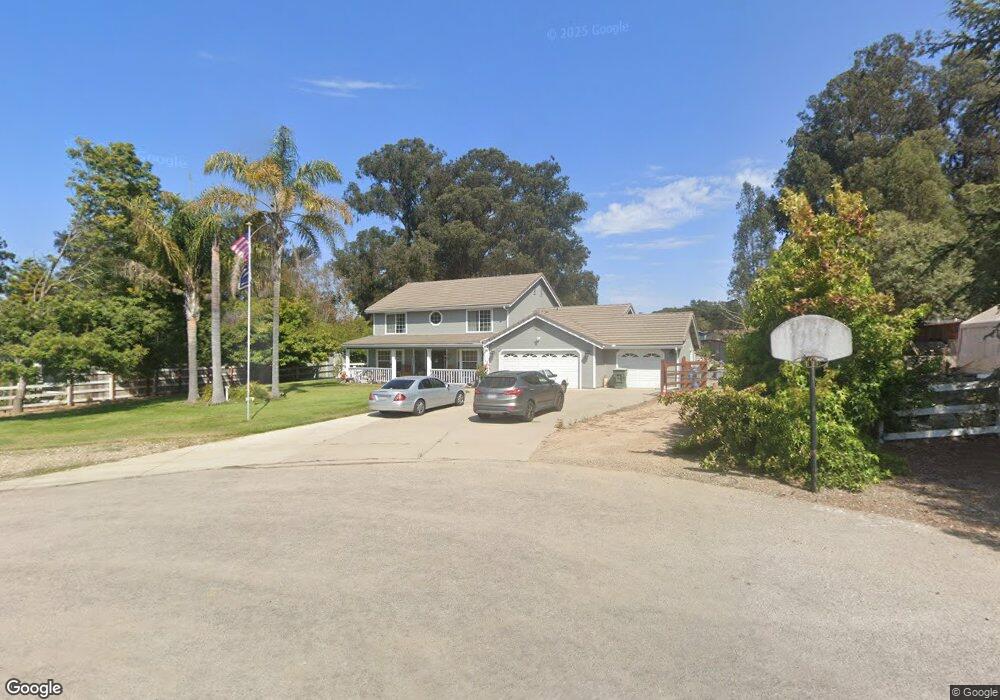
929 Hunter Ridge Ln Nipomo, CA 93444
Estimated Value: $1,223,922 - $1,292,000
4
Beds
3
Baths
2,500
Sq Ft
$506/Sq Ft
Est. Value
About This Home
This home is located at 929 Hunter Ridge Ln, Nipomo, CA 93444 and is currently estimated at $1,265,981, approximately $506 per square foot. 929 Hunter Ridge Ln is a home located in San Luis Obispo County with nearby schools including Dana Elementary School, Mesa Middle School, and Nipomo High School.
Ownership History
Date
Name
Owned For
Owner Type
Purchase Details
Closed on
Mar 3, 1999
Sold by
Hodson William R and Hodson Nancy S
Bought by
Brewster Michael Lee and Brewster Ericka Ann
Current Estimated Value
Home Financials for this Owner
Home Financials are based on the most recent Mortgage that was taken out on this home.
Original Mortgage
$240,000
Outstanding Balance
$59,526
Interest Rate
7.04%
Estimated Equity
$1,206,455
Purchase Details
Closed on
Sep 12, 1994
Sold by
Shumaker Jon and Shumaker Lynnette
Bought by
Hodson William R and Hodson Nancy S
Home Financials for this Owner
Home Financials are based on the most recent Mortgage that was taken out on this home.
Original Mortgage
$192,000
Interest Rate
8.86%
Mortgage Type
Construction
Create a Home Valuation Report for This Property
The Home Valuation Report is an in-depth analysis detailing your home's value as well as a comparison with similar homes in the area
Home Values in the Area
Average Home Value in this Area
Purchase History
| Date | Buyer | Sale Price | Title Company |
|---|---|---|---|
| Brewster Michael Lee | $307,000 | Chicago Title Co | |
| Hodson William R | $83,500 | Chicago Title Company |
Source: Public Records
Mortgage History
| Date | Status | Borrower | Loan Amount |
|---|---|---|---|
| Open | Brewster Michael Lee | $240,000 | |
| Previous Owner | Hodson William R | $192,000 | |
| Closed | Brewster Michael Lee | $20,950 |
Source: Public Records
Tax History
| Year | Tax Paid | Tax Assessment Tax Assessment Total Assessment is a certain percentage of the fair market value that is determined by local assessors to be the total taxable value of land and additions on the property. | Land | Improvement |
|---|---|---|---|---|
| 2025 | $4,877 | $481,267 | $195,954 | $285,313 |
| 2024 | $4,820 | $471,831 | $192,112 | $279,719 |
| 2023 | $4,820 | $462,581 | $188,346 | $274,235 |
| 2022 | $4,745 | $453,511 | $184,653 | $268,858 |
| 2021 | $4,735 | $444,620 | $181,033 | $263,587 |
| 2020 | $4,680 | $440,062 | $179,177 | $260,885 |
| 2019 | $4,650 | $431,434 | $175,664 | $255,770 |
| 2018 | $4,593 | $422,975 | $172,220 | $250,755 |
| 2017 | $4,506 | $414,683 | $168,844 | $245,839 |
| 2016 | $4,248 | $406,553 | $165,534 | $241,019 |
| 2015 | $4,186 | $400,447 | $163,048 | $237,399 |
| 2014 | $4,029 | $392,604 | $159,855 | $232,749 |
Source: Public Records
Map
Nearby Homes
- 680 Sweet Donna Place
- 760 Black Oak Ln
- 1089 Olympic Way
- 940 Calle Fresa
- 12 Oakglen S
- 770 & 772 Beverly
- 182 172 E Chestnut
- 1093 Camino Caballo
- 745 Inga Rd
- 219 Lema Dr
- 1060 Dawn Rd
- 850 Primrose Ln
- 228 Chaparral Ln
- 1160 Oakmont Place Unit 1
- 778 Primrose Ln
- 1071 Ford Dr
- 1024 Maggie Ln
- 250 Via Promesa
- 1255 Viva Way
- 639 Barberry Way
- 925 Hunter Ridge Ln
- 950 Tall Trees Dr
- 950 Tall Tree Dr
- 936 Hunter Ridge Ln
- 925 Blue Gum Ln
- 920 Tall Trees Dr
- 920 Tall Trees Dr
- 935 Blue Gum Ln
- 928 Hunter Ridge Ln
- 917 Blue Gum Ln
- 925 Tall Tree Dr
- 925 Tall Trees Dr
- 917 Hunter Ridge Ln
- 955 Tall Trees Dr
- 924 Blue Gum Ln
- 863 Peggy Lee Ct
- 953 Blue Gum Ln
- 908 Blue Gum Ln
- 936 Blue Gum Ln
Your Personal Tour Guide
Ask me questions while you tour the home.