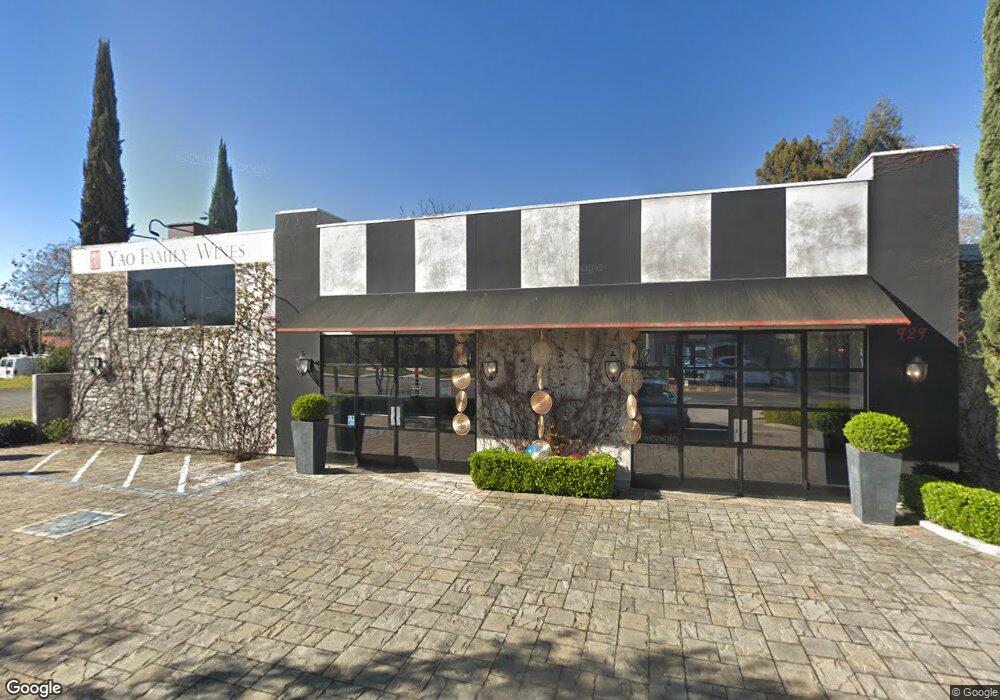
929 Main St St. Helena, CA 94574
Estimated Value: $4,800,100
Studio
--
Bath
3,456
Sq Ft
$1,389/Sq Ft
Est. Value
About This Home
This home is located at 929 Main St, St. Helena, CA 94574 and is currently estimated at $4,800,100, approximately $1,388 per square foot. 929 Main St is a home located in Napa County with nearby schools including Saint Helena Elementary School, Saint Helena Primary School, and Robert Louis Stevenson Intermediate School.
Ownership History
Date
Name
Owned For
Owner Type
Purchase Details
Closed on
Feb 6, 2026
Sold by
929 Main Street Llc
Bought by
Plausible Deniability Llc
Current Estimated Value
Home Financials for this Owner
Home Financials are based on the most recent Mortgage that was taken out on this home.
Original Mortgage
$1,190,000
Outstanding Balance
$1,190,000
Interest Rate
6.15%
Estimated Equity
$3,610,100
Purchase Details
Closed on
Nov 10, 2015
Sold by
Bello Christopher J
Bought by
929 Main Street Llc
Home Financials for this Owner
Home Financials are based on the most recent Mortgage that was taken out on this home.
Original Mortgage
$2,240,000
Interest Rate
3.73%
Mortgage Type
Commercial
Purchase Details
Closed on
Aug 20, 2013
Sold by
Premier Trust Inc
Bought by
Bello Christopher J
Home Financials for this Owner
Home Financials are based on the most recent Mortgage that was taken out on this home.
Original Mortgage
$921,000
Interest Rate
4.33%
Mortgage Type
Commercial
Purchase Details
Closed on
Aug 16, 2013
Sold by
Bello Chloe
Bought by
Bello Christopher J
Home Financials for this Owner
Home Financials are based on the most recent Mortgage that was taken out on this home.
Original Mortgage
$921,000
Interest Rate
4.33%
Mortgage Type
Commercial
Purchase Details
Closed on
Dec 19, 2012
Sold by
Bello Nancy Ann
Bought by
Premier Trust Inc and Irrevocable Nancy Bello 2012 Trust
Purchase Details
Closed on
Apr 24, 2012
Sold by
Bello Michael Ru and Bello Nancy Ann
Bought by
Mb Investment Group Llc
Purchase Details
Closed on
Dec 1, 2010
Sold by
First American Title Company Of Napa
Bought by
Ru Investments Llc
Purchase Details
Closed on
May 9, 2009
Sold by
Buresh Donald F and Phillips Sharon J
Bought by
Ru Investments Llc
Home Financials for this Owner
Home Financials are based on the most recent Mortgage that was taken out on this home.
Original Mortgage
$900,000
Interest Rate
4.71%
Mortgage Type
Seller Take Back
Purchase Details
Closed on
Apr 3, 2003
Sold by
Buresh Donald F
Bought by
Buresh Donald F and Phillips Sharon J
Home Financials for this Owner
Home Financials are based on the most recent Mortgage that was taken out on this home.
Original Mortgage
$450,000
Interest Rate
5.73%
Mortgage Type
Commercial
Purchase Details
Closed on
Sep 9, 1998
Sold by
Penland Robert K and Penland Ferral G
Bought by
Buresh Donald F and Buresh Ann Marie
Home Financials for this Owner
Home Financials are based on the most recent Mortgage that was taken out on this home.
Original Mortgage
$300,000
Interest Rate
6.88%
Mortgage Type
Seller Take Back
Create a Home Valuation Report for This Property
The Home Valuation Report is an in-depth analysis detailing your home's value as well as a comparison with similar homes in the area
Home Values in the Area
Average Home Value in this Area
Purchase History
| Date | Buyer | Sale Price | Title Company |
|---|---|---|---|
| Plausible Deniability Llc | $2,900,000 | Placer Title | |
| 929 Main Street Llc | $3,200,000 | First American Title Company | |
| Bello Christopher J | $900,000 | North American Title Company | |
| Bello Christopher J | -- | North American Title Company | |
| Premier Trust Inc | -- | None Available | |
| Premier Trust Inc | -- | None Available | |
| Bello Michael Ru | -- | None Available | |
| Mb Investment Group Llc | -- | None Available | |
| Bello Michael Ru | -- | None Available | |
| Ru Investments Llc | $25,000 | None Available | |
| Ru Investments Llc | $1,500,000 | Fidelity National Title | |
| Buresh Donald F | -- | Fidelity National Title Co | |
| Buresh Donald F | $500,000 | Fidelity National Title Co |
Source: Public Records
Mortgage History
| Date | Status | Borrower | Loan Amount |
|---|---|---|---|
| Open | Plausible Deniability Llc | $1,190,000 | |
| Closed | Plausible Deniability Llc | $1,487,500 | |
| Previous Owner | 929 Main Street Llc | $2,240,000 | |
| Previous Owner | Bello Christopher J | $921,000 | |
| Previous Owner | Ru Investments Llc | $900,000 | |
| Previous Owner | Buresh Donald F | $450,000 | |
| Previous Owner | Buresh Donald F | $300,000 |
Source: Public Records
Tax History
| Year | Tax Paid | Tax Assessment Tax Assessment Total Assessment is a certain percentage of the fair market value that is determined by local assessors to be the total taxable value of land and additions on the property. | Land | Improvement |
|---|---|---|---|---|
| 2025 | $40,407 | $3,788,145 | $1,775,693 | $2,012,452 |
| 2024 | $39,618 | $3,713,869 | $1,740,876 | $1,972,993 |
| 2023 | $39,618 | $3,641,049 | $1,706,742 | $1,934,307 |
| 2022 | $37,636 | $3,569,657 | $1,673,277 | $1,896,380 |
| 2021 | $37,136 | $3,499,665 | $1,640,468 | $1,859,197 |
| 2020 | $36,768 | $3,463,782 | $1,623,648 | $1,840,134 |
| 2019 | $36,128 | $3,395,865 | $1,591,812 | $1,804,053 |
| 2018 | $35,546 | $3,329,280 | $1,560,600 | $1,768,680 |
| 2017 | $34,882 | $3,264,000 | $1,530,000 | $1,734,000 |
| 2016 | $34,147 | $3,200,000 | $1,500,000 | $1,700,000 |
| 2015 | $25,582 | $2,377,814 | $1,019,980 | $1,357,834 |
| 2014 | $25,407 | $2,337,081 | $1,000,000 | $1,337,081 |
Source: Public Records
Map
Nearby Homes
- 1017 Charter Oak Ave
- 945 Brown St
- 1123 Oak Ave
- 1133 Oak Ave
- 1530 Voorhees Cir
- 1551 Spring St
- 921 Chiles Ave
- 1503 Tainter St
- 1209 Stockton St
- 844 Signorelli Cir
- 760 Granada Ct
- 1243 Stockton St
- 1664 Spring St
- 1711 Tainter St
- 806 Chiles Ave
- 2060 Olive Ave
- 1143 Hudson Ave
- 1430 Stockton St
- 1777 Adams St
- 2040 Olive Ave
- 1071 Charter Oak Ave
- 933 Main St
- 1043 Charter Oak Ave
- 1032 Charter Oak Ave
- 1026 Charter Oak Ave
- 1027 Charter Oak Ave
- 1014 Charter Oak Ave
- 1008 Charter Oak Ave
- 1317 Mitchell Dr
- 1007 Charter Oak Ave Unit 9
- 1000 Charter Oak Ave
- 1369 Saint James Dr
- 1323 Mitchell Dr
- 1365 Saint James Dr
- 1080 Main St
- 1080 Main St Unit B
- 1373 Saint James Dr
- 1333 Mitchell Dr
- 1361 Saint James Dr
- 1000 Brown St
Your Personal Tour Guide
Ask me questions while you tour the home.