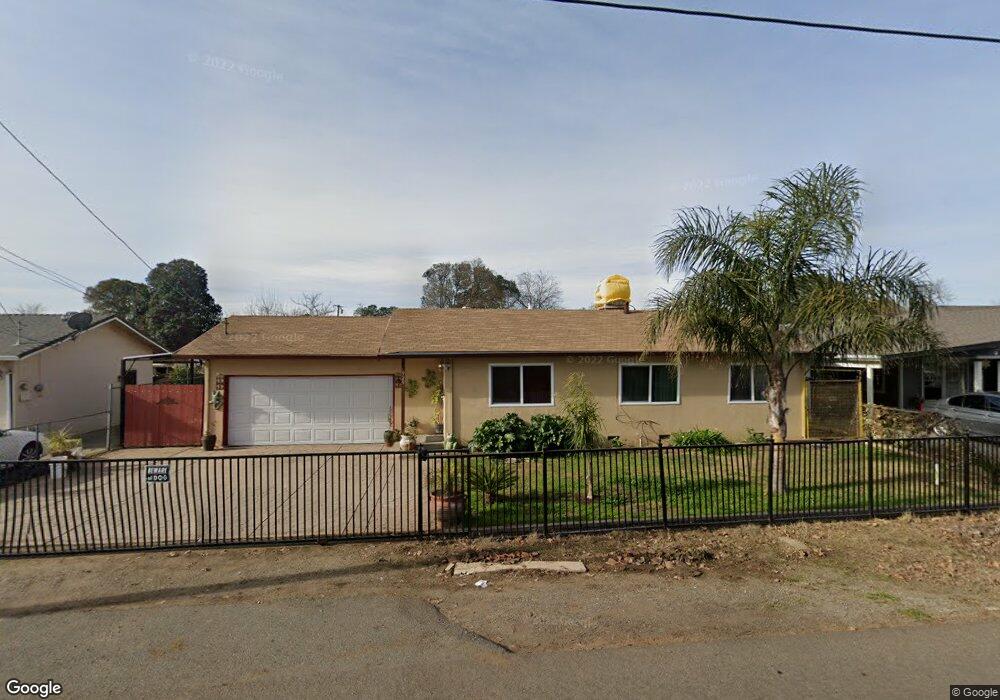
929 S Carroll Ave Stockton, CA 95215
Garden Acres NeighborhoodEstimated Value: $184,000 - $426,000
3
Beds
1
Bath
1,008
Sq Ft
$324/Sq Ft
Est. Value
About This Home
This home is located at 929 S Carroll Ave, Stockton, CA 95215 and is currently estimated at $326,597, approximately $324 per square foot. 929 S Carroll Ave is a home located in San Joaquin County with nearby schools including Wilhelmina Henry Elementary School, Elmwood Elementary School, and Montezuma Elementary School.
Ownership History
Date
Name
Owned For
Owner Type
Purchase Details
Closed on
Aug 25, 2011
Sold by
Estrada Maricela Rodriguez
Bought by
Bedoy Andres and Bedoy Maria Del Rosario
Current Estimated Value
Purchase Details
Closed on
Sep 30, 2005
Sold by
Rodriguez Marisela and Estrada Carlos
Bought by
Estrada Marisela Rodriguez
Home Financials for this Owner
Home Financials are based on the most recent Mortgage that was taken out on this home.
Original Mortgage
$240,000
Interest Rate
1.5%
Mortgage Type
Negative Amortization
Purchase Details
Closed on
Dec 10, 2003
Sold by
Callicoat Billy D and Callicoat Sherry A
Bought by
Rodriguez Marisela and Estrada Carlos
Home Financials for this Owner
Home Financials are based on the most recent Mortgage that was taken out on this home.
Original Mortgage
$178,000
Interest Rate
8.25%
Mortgage Type
Purchase Money Mortgage
Purchase Details
Closed on
Jul 17, 2001
Sold by
Va
Bought by
Callicoat Billy D and Callicoat Sherry A
Create a Home Valuation Report for This Property
The Home Valuation Report is an in-depth analysis detailing your home's value as well as a comparison with similar homes in the area
Home Values in the Area
Average Home Value in this Area
Purchase History
| Date | Buyer | Sale Price | Title Company |
|---|---|---|---|
| Bedoy Andres | $53,000 | Lawyers Title | |
| Estrada Marisela Rodriguez | -- | Fidelity National | |
| Rodriguez Marisela | $178,000 | Chicago Title Co | |
| Callicoat Billy D | -- | -- |
Source: Public Records
Mortgage History
| Date | Status | Borrower | Loan Amount |
|---|---|---|---|
| Previous Owner | Estrada Marisela Rodriguez | $240,000 | |
| Previous Owner | Rodriguez Marisela | $178,000 |
Source: Public Records
Tax History Compared to Growth
Tax History
| Year | Tax Paid | Tax Assessment Tax Assessment Total Assessment is a certain percentage of the fair market value that is determined by local assessors to be the total taxable value of land and additions on the property. | Land | Improvement |
|---|---|---|---|---|
| 2025 | $937 | $66,561 | $16,324 | $50,237 |
| 2024 | $1,152 | $65,256 | $16,004 | $49,252 |
| 2023 | $902 | $63,978 | $15,691 | $48,287 |
| 2022 | $856 | $62,725 | $15,384 | $47,341 |
| 2021 | $825 | $61,496 | $15,083 | $46,413 |
| 2020 | $1,218 | $60,867 | $14,929 | $45,938 |
| 2019 | $1,041 | $59,675 | $14,637 | $45,038 |
| 2018 | $2,540 | $58,505 | $14,350 | $44,155 |
| 2017 | $1,065 | $57,359 | $14,069 | $43,290 |
| 2016 | $898 | $56,234 | $13,793 | $42,441 |
| 2014 | $774 | $54,305 | $13,320 | $40,985 |
Source: Public Records
Map
Nearby Homes
- 833 S Sinclair Ave
- 4733 E Main St
- 727 S Sinclair Ave
- 5031 E Meadowood Dr
- 5030 E Turin Ct
- 917 S Mylea Ct
- 5033 E Turin Ct
- 5047 E Meadowood Dr
- 4854 E Goshawk Ct
- 5046 E Turin Ct
- 4996 Horner Ave
- 5063 E Meadowood Dr
- 5008 Horner Ave
- 918 S Mylea Ct
- 906 S Mylea Ct
- 5030 Horner Ave
- 5079 E Meadowood Dr
- 5051 E Cadence St
- 5077 E Turin Ct
- 5042 Horner Ave
- 941 S Carroll Ave
- 915 S Carroll Ave
- 930 S Coolidge Ave
- 918 S Coolidge Ave
- 949 S Carroll Ave
- 928 S Carroll Ave
- 940 S Carroll Ave
- 906 S Coolidge Ave
- 950 S Coolidge Ave
- 839 S Carroll Ave
- 1001 S Carroll Ave
- 902 S Carroll Ave
- 952 S Carroll Ave
- 840 S Coolidge Ave
- 1006 S Coolidge Ave
- 1010 S Carroll Ave
- 840 S Carroll Ave
- 927 S Coolidge Ave
- 929 S Dawes Ave
- 917 S Coolidge Ave