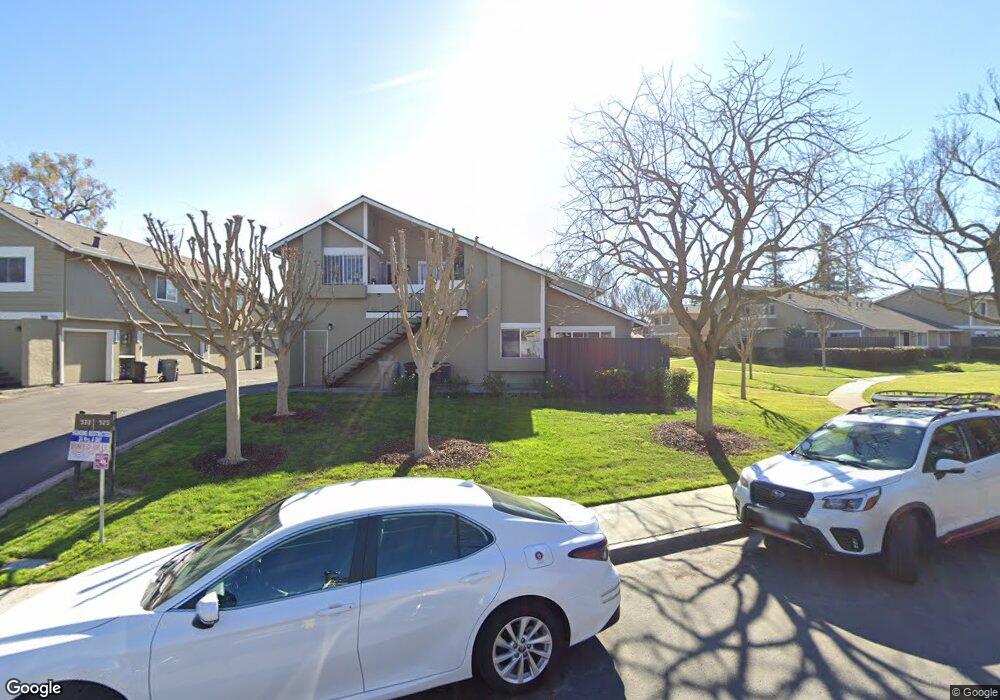
929 Summerside Dr Unit C San Jose, CA 95122
Yerba Buena NeighborhoodEstimated Value: $671,000 - $803,000
3
Beds
2
Baths
1,165
Sq Ft
$617/Sq Ft
Est. Value
About This Home
This home is located at 929 Summerside Dr Unit C, San Jose, CA 95122 and is currently estimated at $718,938, approximately $617 per square foot. 929 Summerside Dr Unit C is a home located in Santa Clara County with nearby schools including Stonegate Elementary School, Sylvandale Middle School, and Yerba Buena High School.
Ownership History
Date
Name
Owned For
Owner Type
Purchase Details
Closed on
Nov 18, 2008
Sold by
Jp Morgan Chase Bank National Associatio
Bought by
Nguyen Jason C
Current Estimated Value
Home Financials for this Owner
Home Financials are based on the most recent Mortgage that was taken out on this home.
Original Mortgage
$210,000
Outstanding Balance
$137,781
Interest Rate
6.07%
Mortgage Type
Purchase Money Mortgage
Estimated Equity
$581,157
Purchase Details
Closed on
Nov 7, 2008
Sold by
Tran Linda Hoa
Bought by
Nguyen Jason C
Home Financials for this Owner
Home Financials are based on the most recent Mortgage that was taken out on this home.
Original Mortgage
$210,000
Outstanding Balance
$137,781
Interest Rate
6.07%
Mortgage Type
Purchase Money Mortgage
Estimated Equity
$581,157
Purchase Details
Closed on
Aug 18, 2008
Sold by
Castillo Arturo and Sandoval Francisco
Bought by
Washington Mutual Bank
Purchase Details
Closed on
Mar 27, 2006
Sold by
Betran Blanca E
Bought by
Castillo Arturo
Home Financials for this Owner
Home Financials are based on the most recent Mortgage that was taken out on this home.
Original Mortgage
$97,000
Interest Rate
6.25%
Mortgage Type
Stand Alone Second
Purchase Details
Closed on
Dec 14, 2004
Sold by
Ruiz Kimberly M and Ruiz Randy
Bought by
Hampton Michael and Hampton Erica
Home Financials for this Owner
Home Financials are based on the most recent Mortgage that was taken out on this home.
Original Mortgage
$324,000
Interest Rate
5.54%
Mortgage Type
Purchase Money Mortgage
Purchase Details
Closed on
Aug 13, 1999
Sold by
Randy Ruiz and Randy Kimberly M
Bought by
Ruiz Randy and Ruiz Kimberly M
Home Financials for this Owner
Home Financials are based on the most recent Mortgage that was taken out on this home.
Original Mortgage
$172,500
Interest Rate
7.56%
Purchase Details
Closed on
Jan 2, 1997
Sold by
Woodfint Beverly J and Woodfint William R
Bought by
Ruiz Randy and Ruiz Kimberly M
Home Financials for this Owner
Home Financials are based on the most recent Mortgage that was taken out on this home.
Original Mortgage
$132,500
Interest Rate
7.53%
Create a Home Valuation Report for This Property
The Home Valuation Report is an in-depth analysis detailing your home's value as well as a comparison with similar homes in the area
Home Values in the Area
Average Home Value in this Area
Purchase History
| Date | Buyer | Sale Price | Title Company |
|---|---|---|---|
| Nguyen Jason C | $285,000 | Chicago Title | |
| Nguyen Jason C | -- | Servicelink | |
| Washington Mutual Bank | $224,000 | None Available | |
| Castillo Arturo | -- | Alliance Title Company | |
| Saldovar Francisco | -- | Alliance Title Company | |
| Castillo Arturo | $485,000 | Alliance Title Company | |
| Hampton Michael | $405,000 | Chicago Title | |
| Ruiz Randy | -- | Chicago Title Co | |
| Ruiz Randy | $139,500 | American Title Co |
Source: Public Records
Mortgage History
| Date | Status | Borrower | Loan Amount |
|---|---|---|---|
| Open | Nguyen Jason C | $210,000 | |
| Previous Owner | Castillo Arturo | $97,000 | |
| Previous Owner | Castillo Arturo | $388,000 | |
| Previous Owner | Saldovar Francisco | $97,000 | |
| Previous Owner | Hampton Michael | $324,000 | |
| Previous Owner | Ruiz Randy | $172,500 | |
| Previous Owner | Ruiz Randy | $132,500 | |
| Closed | Hampton Michael | $60,750 |
Source: Public Records
Tax History Compared to Growth
Tax History
| Year | Tax Paid | Tax Assessment Tax Assessment Total Assessment is a certain percentage of the fair market value that is determined by local assessors to be the total taxable value of land and additions on the property. | Land | Improvement |
|---|---|---|---|---|
| 2025 | $5,868 | $360,554 | $180,277 | $180,277 |
| 2024 | $5,868 | $353,486 | $176,743 | $176,743 |
| 2023 | $5,868 | $346,556 | $173,278 | $173,278 |
| 2022 | $5,659 | $339,762 | $169,881 | $169,881 |
| 2021 | $5,614 | $333,100 | $166,550 | $166,550 |
| 2020 | $5,378 | $329,686 | $164,843 | $164,843 |
| 2019 | $5,154 | $323,222 | $161,611 | $161,611 |
| 2018 | $5,141 | $316,886 | $158,443 | $158,443 |
| 2017 | $5,072 | $310,674 | $155,337 | $155,337 |
| 2016 | $4,823 | $304,584 | $152,292 | $152,292 |
| 2015 | $4,728 | $300,010 | $150,005 | $150,005 |
| 2014 | $4,235 | $294,134 | $147,067 | $147,067 |
Source: Public Records
Map
Nearby Homes
- 2102 Galveston Ave Unit A
- 2102 Galveston Ave Unit B
- 988 Summerplace Dr
- 2175 Summerton Dr
- 1042 Summermist Ct Unit 107
- 1034 Summerplace Dr
- 1050 Summermist Ct
- 1117 Indian Summer Ct
- 1058 Tekman Dr Unit 58
- 2416 Balme Dr
- 1087 Summerain Ct
- 2015 Tahiti Ct
- 1231 Turtlerock Dr
- 963 Mills Corner Ln
- 2580 Senter Rd Unit 455
- 2580 Senter Rd Unit 515
- 2566 Boren Dr
- 1887 Aberdeen Ct
- 1714 Bevin Brook Dr
- 1381 Taper Ct
- 929 Summerside Dr Unit D
- 929 Summerside Dr Unit B
- 929 Summerside Dr Unit A
- 2108 Galveston Ave Unit B
- 2108 Galveston Ave Unit A
- 2108 Galveston Ave Unit D
- 2108 Galveston Ave Unit C
- 933 Summerside Dr Unit D
- 933 Summerside Dr Unit C
- 933 Summerside Dr Unit B
- 933 Summerside Dr Unit A
- 2116 Galveston Ave Unit D
- 2116 Galveston Ave Unit D
- 2116 Galveston Ave Unit C
- 2116 Galveston Ave Unit A
- 2209 Warfield Way Unit D
- 2209 Warfield Way Unit C
- 2209 Warfield Way Unit B
- 2209 Warfield Way Unit A
- 2102 Galveston Ave Unit D