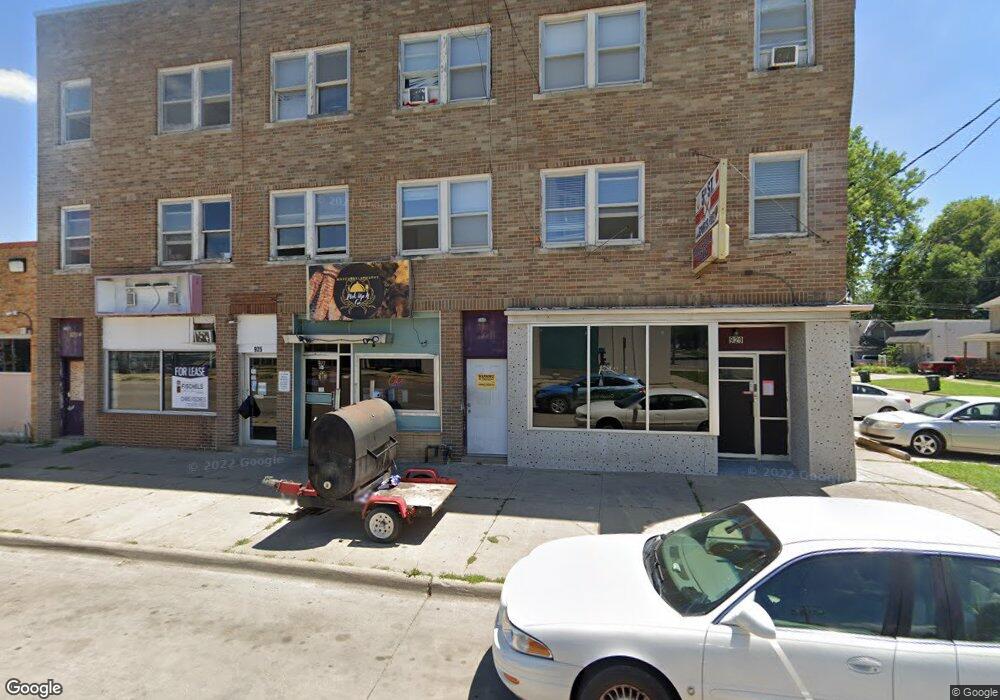
929 W 5th St Unit 929 Waterloo, IA 50702
Neighbors Helping Neighbors NeighborhoodEstimated Value: $369,428
Studio
--
Bath
1,200
Sq Ft
$308/Sq Ft
Est. Value
About This Home
This home is located at 929 W 5th St Unit 929, Waterloo, IA 50702 and is currently estimated at $369,428, approximately $307 per square foot. 929 W 5th St Unit 929 is a home located in Black Hawk County with nearby schools including Irving Elementary School, Central Middle School, and West High School.
Ownership History
Date
Name
Owned For
Owner Type
Purchase Details
Closed on
Apr 30, 2024
Sold by
Red Cedar Properties Llc
Bought by
Cfo Development Llc
Current Estimated Value
Purchase Details
Closed on
Dec 4, 2020
Sold by
Bne Investments Llc
Bought by
Red Cedar Properties Llc
Purchase Details
Closed on
Jan 20, 2017
Sold by
Bne Investments Llc
Bought by
Red Cedar Properties Llc
Create a Home Valuation Report for This Property
The Home Valuation Report is an in-depth analysis detailing your home's value as well as a comparison with similar homes in the area
Home Values in the Area
Average Home Value in this Area
Purchase History
| Date | Buyer | Sale Price | Title Company |
|---|---|---|---|
| Cfo Development Llc | $275,000 | None Listed On Document | |
| Cfo Development Llc | $275,000 | None Listed On Document | |
| Red Cedar Properties Llc | $249,875 | None Listed On Document | |
| Red Cedar Properties Llc | $250,000 | None Listed On Document | |
| Red Cedar Properties Llc | $249,875 | None Listed On Document | |
| Red Cedar Properties Llc | $250,000 | None Listed On Document | |
| Red Cedar Properties Llc | -- | None Available | |
| Red Cedar Properties Llc | -- | None Available |
Source: Public Records
Tax History
| Year | Tax Paid | Tax Assessment Tax Assessment Total Assessment is a certain percentage of the fair market value that is determined by local assessors to be the total taxable value of land and additions on the property. | Land | Improvement |
|---|---|---|---|---|
| 2025 | $7,424 | $302,450 | $12,750 | $289,700 |
| 2024 | $7,424 | $302,030 | $12,750 | $289,280 |
| 2023 | $4,192 | $302,030 | $12,750 | $289,280 |
| 2022 | $4,466 | $190,940 | $10,200 | $180,740 |
| 2021 | $4,774 | $190,940 | $10,200 | $180,740 |
| 2020 | $4,918 | $190,940 | $10,200 | $180,740 |
| 2019 | $4,918 | $185,534 | $4,794 | $180,740 |
| 2018 | $6,432 | $185,534 | $4,794 | $180,740 |
| 2017 | $5,428 | $185,534 | $4,794 | $180,740 |
| 2016 | $6,854 | $185,534 | $4,794 | $180,740 |
| 2015 | $6,854 | $185,534 | $4,794 | $180,740 |
| 2014 | $7,134 | $191,050 | $10,200 | $180,850 |
Source: Public Records
Map
Nearby Homes