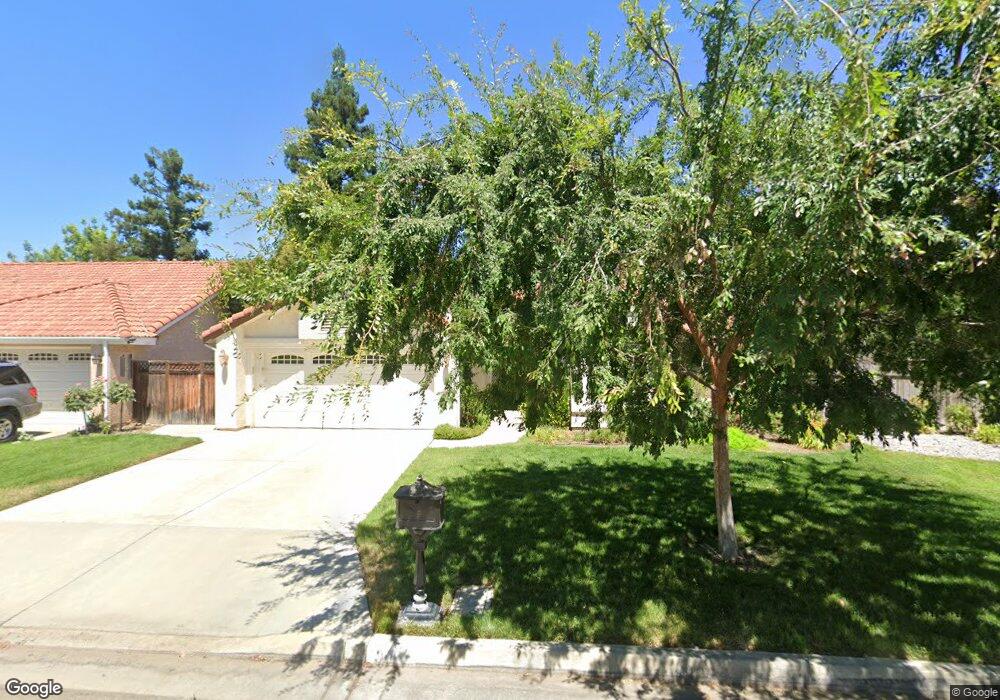
9298 N Concord Dr Fresno, CA 93720
Woodward Park NeighborhoodEstimated Value: $432,827 - $500,000
3
Beds
3
Baths
1,693
Sq Ft
$281/Sq Ft
Est. Value
About This Home
This home is located at 9298 N Concord Dr, Fresno, CA 93720 and is currently estimated at $475,707, approximately $280 per square foot. 9298 N Concord Dr is a home located in Fresno County with nearby schools including Valley Oak Elementary School, Kastner Intermediate School, and Clovis West High School.
Ownership History
Date
Name
Owned For
Owner Type
Purchase Details
Closed on
Apr 25, 2014
Sold by
Win Min Soe and Myat Thin
Bought by
Win & Myat Llc
Current Estimated Value
Purchase Details
Closed on
Sep 19, 2013
Sold by
Martinusen Sandra K
Bought by
Win Min Soe and Myat Thin
Home Financials for this Owner
Home Financials are based on the most recent Mortgage that was taken out on this home.
Original Mortgage
$202,400
Outstanding Balance
$151,574
Interest Rate
4.49%
Mortgage Type
New Conventional
Estimated Equity
$324,133
Purchase Details
Closed on
Aug 14, 2007
Sold by
Donaghy Mary and Mary Donaghy Living Trust
Bought by
Martinusen Gilbert J and Martinusen Sandra K
Home Financials for this Owner
Home Financials are based on the most recent Mortgage that was taken out on this home.
Original Mortgage
$255,200
Interest Rate
6.46%
Mortgage Type
Purchase Money Mortgage
Purchase Details
Closed on
Oct 26, 2001
Sold by
Donaghy Mary W
Bought by
Donaghy Mary and Mary Donaghy Living Trust
Create a Home Valuation Report for This Property
The Home Valuation Report is an in-depth analysis detailing your home's value as well as a comparison with similar homes in the area
Home Values in the Area
Average Home Value in this Area
Purchase History
| Date | Buyer | Sale Price | Title Company |
|---|---|---|---|
| Win & Myat Llc | -- | None Available | |
| Win Min Soe | $253,000 | Chicago Title Company | |
| Martinusen Gilbert J | $319,000 | Stewart Title Fresno | |
| Donaghy Mary | -- | -- |
Source: Public Records
Mortgage History
| Date | Status | Borrower | Loan Amount |
|---|---|---|---|
| Open | Win Min Soe | $202,400 | |
| Previous Owner | Martinusen Gilbert J | $255,200 |
Source: Public Records
Tax History Compared to Growth
Tax History
| Year | Tax Paid | Tax Assessment Tax Assessment Total Assessment is a certain percentage of the fair market value that is determined by local assessors to be the total taxable value of land and additions on the property. | Land | Improvement |
|---|---|---|---|---|
| 2025 | $3,694 | $310,133 | $93,038 | $217,095 |
| 2023 | $3,624 | $298,092 | $89,426 | $208,666 |
| 2022 | $3,575 | $292,248 | $87,673 | $204,575 |
| 2021 | $3,476 | $286,518 | $85,954 | $200,564 |
| 2020 | $3,462 | $283,581 | $85,073 | $198,508 |
| 2019 | $3,395 | $278,021 | $83,405 | $194,616 |
| 2018 | $3,321 | $272,570 | $81,770 | $190,800 |
| 2017 | $3,264 | $267,226 | $80,167 | $187,059 |
| 2016 | $3,155 | $261,988 | $78,596 | $183,392 |
| 2015 | $3,106 | $258,054 | $77,416 | $180,638 |
| 2014 | $3,049 | $253,000 | $75,900 | $177,100 |
Source: Public Records
Map
Nearby Homes
- 9260 N Green Meadows Ln
- 343 E Deer Creek Ln
- 564 E Braddock Dr
- 9098 N Cherryhill Ln
- 9094 N Cherryhill Ln
- 9161 N Woodlawn Dr
- 355 E Everglade Ave
- 316 E Lester Ave
- 264 E Loyola Ave
- 787 E Buckhill Rd
- 793 E Buckhill Rd
- 9109 N Chadwick Ln
- 9360 N 9360 N Blackstone Ave Unit 201
- 790 E Serena Ave
- 9360 N Blackstone Ave Unit 116
- 9360 N Blackstone Ave Unit 243
- 9360 N Blackstone Ave Unit 213
- 9360 N Blackstone Ave Unit 107
- 9360 N Blackstone Ave Unit 238
- 9360 N Blackstone Ave Unit 236
- 9308 N Concord Dr
- 9286 N Concord Dr
- 9305 N Ashford Ave
- 9276 N Concord Dr
- 9318 N Concord Dr
- 9289 N Concord Dr
- 9289 N Ashford Ave
- 9304 N Green Meadows Ln
- 9327 N Ashford Ave
- 9292 N Green Meadows Ln
- 9330 N Concord Dr
- 9264 N Concord Dr
- 9269 N Concord Dr
- 9282 N Green Meadows Ln
- 9267 N Ashford Ave
- 9270 N Green Meadows Ln
- 9254 N Concord Dr
- 9257 N Concord Dr
- 9340 N Concord Dr
- 9349 N Ashford Ave