Estimated Value: $1,561,885 - $2,098,000
5
Beds
5
Baths
4,948
Sq Ft
$370/Sq Ft
Est. Value
About This Home
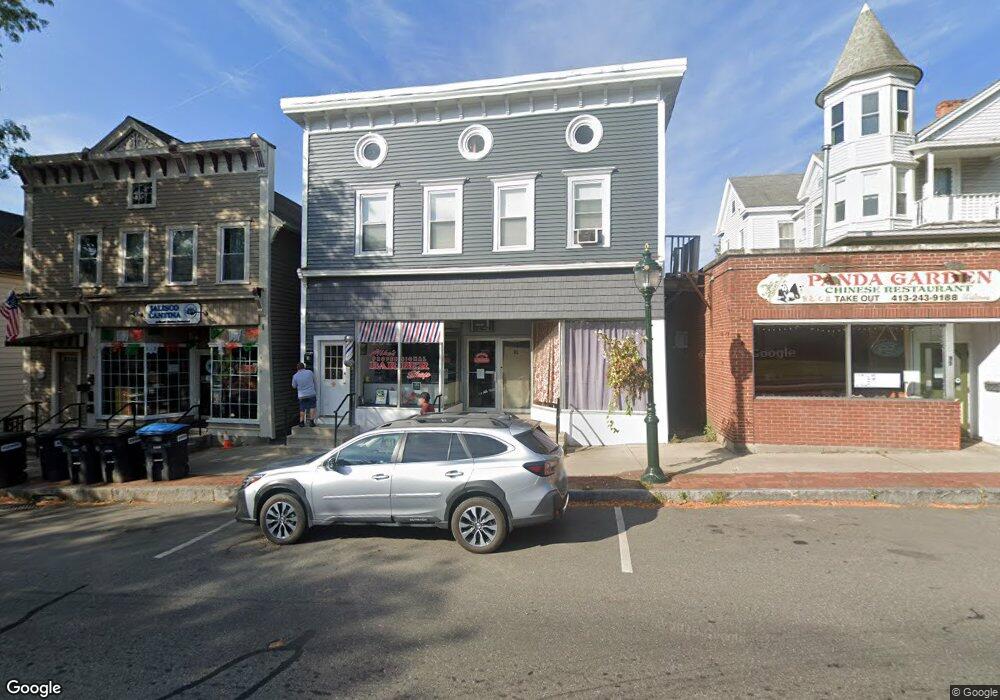
This home is located at 93 Main St, Lee, MA 01238 and is currently estimated at $1,830,295, approximately $369 per square foot. 93 Main St is a home located in Berkshire County with nearby schools including Lee Elementary School, Lee Middle/High School, and St. Mary's School.
Ownership History
Date
Name
Owned For
Owner Type
Purchase Details
Closed on
Nov 4, 2020
Sold by
Herbst Ann C
Bought by
Lederman Eric D and Lederman Kimberly W
Current Estimated Value
Home Financials for this Owner
Home Financials are based on the most recent Mortgage that was taken out on this home.
Original Mortgage
$500,000
Outstanding Balance
$444,929
Interest Rate
2.8%
Mortgage Type
New Conventional
Estimated Equity
$1,385,366
Purchase Details
Closed on
Sep 28, 1992
Sold by
Eisenberg Marcia J Est
Bought by
Herbst Ann Colin
Create a Home Valuation Report for This Property
The Home Valuation Report is an in-depth analysis detailing your home's value as well as a comparison with similar homes in the area
Home Values in the Area
Average Home Value in this Area
Purchase History
| Date | Buyer | Sale Price | Title Company |
|---|---|---|---|
| Lederman Eric D | $1,400,000 | None Available | |
| Herbst Ann Colin | $375,000 | -- |
Source: Public Records
Mortgage History
| Date | Status | Borrower | Loan Amount |
|---|---|---|---|
| Open | Lederman Eric D | $500,000 |
Source: Public Records
Tax History
| Year | Tax Paid | Tax Assessment Tax Assessment Total Assessment is a certain percentage of the fair market value that is determined by local assessors to be the total taxable value of land and additions on the property. | Land | Improvement |
|---|---|---|---|---|
| 2025 | $9,409 | $1,537,400 | $154,000 | $1,383,400 |
| 2024 | $9,065 | $1,448,100 | $149,600 | $1,298,500 |
| 2023 | $9,161 | $1,392,300 | $142,900 | $1,249,400 |
| 2022 | $7,884 | $1,173,200 | $142,900 | $1,030,300 |
| 2021 | $7,027 | $1,018,400 | $138,600 | $879,800 |
| 2020 | $6,358 | $909,600 | $138,600 | $771,000 |
| 2019 | $6,029 | $898,500 | $138,600 | $759,900 |
| 2018 | $6,176 | $887,300 | $138,600 | $748,700 |
| 2017 | $6,144 | $877,700 | $137,300 | $740,400 |
| 2016 | $5,845 | $867,200 | $137,300 | $729,900 |
| 2015 | $5,680 | $852,900 | $137,300 | $715,600 |
Source: Public Records
Map
Nearby Homes
- 160 High St
- 205 High St
- 131 Center St
- 180 Center St
- 30 Pease Terrace
- 46 Pease Terrace
- 155 Laurel St
- 2 Devon Rd
- 290 E Center St
- 135 East St
- 0 East St Unit 235893
- 140 Theresa Terrace
- 615 Laurel St
- 45 Forest St
- 560 Stockbridge Rd
- 528 Walker St
- 524 Walker St
- 500 Walker St
- 770 Summer St Unit 5D
- 770 Summer St Unit 3A
Your Personal Tour Guide
Ask me questions while you tour the home.