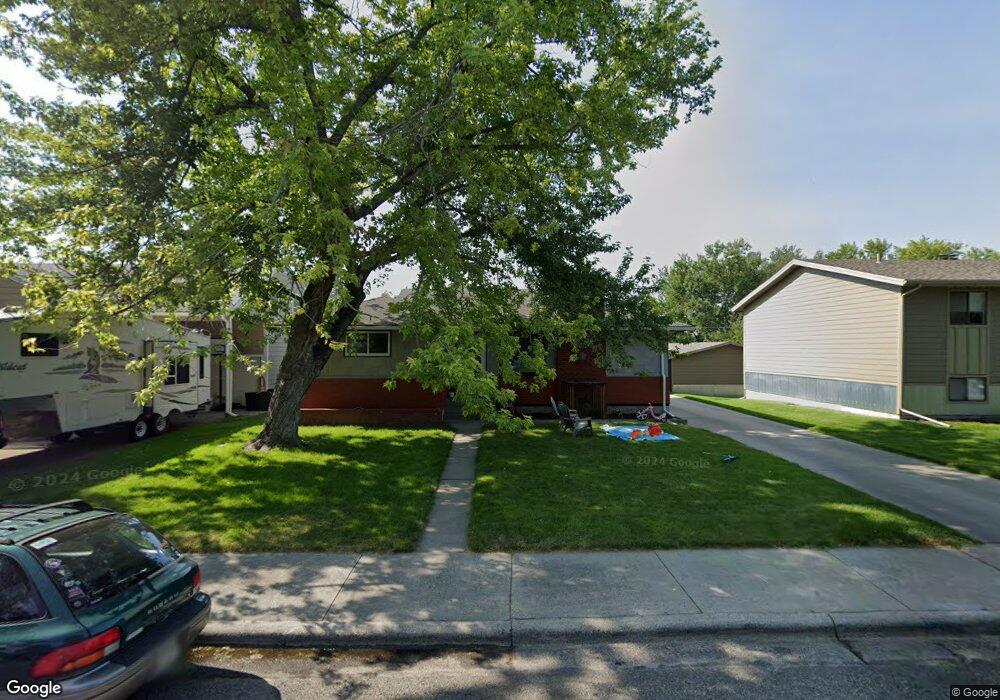
930 Avenue C Billings, MT 59102
Highlands NeighborhoodEstimated Value: $318,000 - $355,000
4
Beds
2
Baths
1,210
Sq Ft
$276/Sq Ft
Est. Value
About This Home
This home is located at 930 Avenue C, Billings, MT 59102 and is currently estimated at $334,515, approximately $276 per square foot. 930 Avenue C is a home located in Yellowstone County with nearby schools including Highland Elementary School, Lewis & Clark Junior High School, and Billings Senior High School.
Ownership History
Date
Name
Owned For
Owner Type
Purchase Details
Closed on
May 14, 2020
Sold by
Thelen Tyler J
Bought by
Thelen Tyler J and Thelen Emily F
Current Estimated Value
Purchase Details
Closed on
Feb 11, 2006
Sold by
Thelen Timothy M
Bought by
Thelen Tyler J
Home Financials for this Owner
Home Financials are based on the most recent Mortgage that was taken out on this home.
Original Mortgage
$124,000
Interest Rate
6.2%
Mortgage Type
New Conventional
Create a Home Valuation Report for This Property
The Home Valuation Report is an in-depth analysis detailing your home's value as well as a comparison with similar homes in the area
Home Values in the Area
Average Home Value in this Area
Purchase History
| Date | Buyer | Sale Price | Title Company |
|---|---|---|---|
| Thelen Tyler J | -- | None Available | |
| Thelen Tyler J | -- | None Available |
Source: Public Records
Mortgage History
| Date | Status | Borrower | Loan Amount |
|---|---|---|---|
| Closed | Thelen Tyler J | $124,000 |
Source: Public Records
Tax History Compared to Growth
Tax History
| Year | Tax Paid | Tax Assessment Tax Assessment Total Assessment is a certain percentage of the fair market value that is determined by local assessors to be the total taxable value of land and additions on the property. | Land | Improvement |
|---|---|---|---|---|
| 2025 | $2,608 | $301,400 | $50,748 | $250,652 |
| 2024 | $2,608 | $264,500 | $46,446 | $218,054 |
| 2023 | $2,667 | $264,500 | $46,446 | $218,054 |
| 2022 | $2,112 | $223,700 | $0 | $0 |
| 2021 | $2,484 | $223,700 | $0 | $0 |
| 2020 | $2,285 | $196,900 | $0 | $0 |
| 2019 | $2,186 | $196,900 | $0 | $0 |
| 2018 | $2,176 | $193,000 | $0 | $0 |
| 2017 | $1,787 | $193,000 | $0 | $0 |
| 2016 | $1,923 | $176,600 | $0 | $0 |
| 2015 | $1,880 | $176,600 | $0 | $0 |
| 2014 | $1,750 | $87,079 | $0 | $0 |
Source: Public Records
Map
Nearby Homes