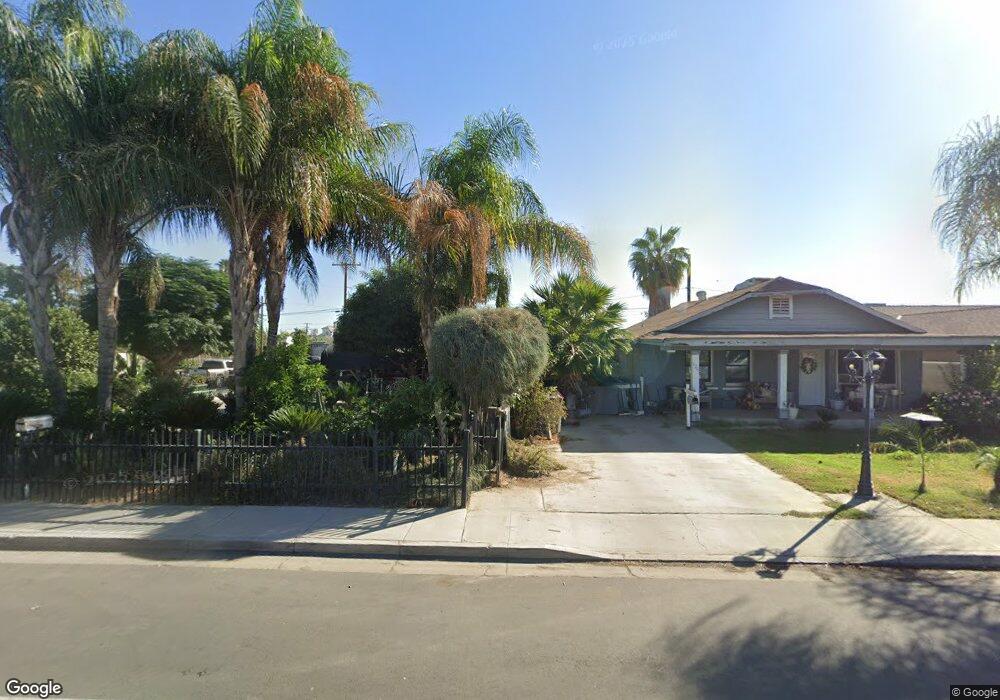
930 Clinton St Delano, CA 93215
West Delano NeighborhoodEstimated Value: $173,000 - $256,000
2
Beds
1
Bath
198
Sq Ft
$1,134/Sq Ft
Est. Value
About This Home
This home is located at 930 Clinton St, Delano, CA 93215 and is currently estimated at $224,620, approximately $1,134 per square foot. 930 Clinton St is a home located in Kern County with nearby schools including Fremont Elementary School, Almond Tree Middle School, and Cesar E. Chavez High School.
Ownership History
Date
Name
Owned For
Owner Type
Purchase Details
Closed on
Mar 20, 2015
Sold by
Napoles Alfredo and Napoles Investment Trust
Bought by
Napoles Maria Agapita and Napoles Investments
Current Estimated Value
Purchase Details
Closed on
Oct 16, 2012
Sold by
Rivera Ignacino Jimenez
Bought by
Napoles Alfredo and Napoles Investment Trust
Purchase Details
Closed on
Jan 28, 2011
Sold by
Jimenez Dario Jimenez
Bought by
Rivera Ignacio Jimenez
Create a Home Valuation Report for This Property
The Home Valuation Report is an in-depth analysis detailing your home's value as well as a comparison with similar homes in the area
Home Values in the Area
Average Home Value in this Area
Purchase History
We collect this data history from publicly available records. To have your information removed, we recommend requesting removal directly through your county’s website.
| Date | Buyer | Sale Price | Title Company |
|---|---|---|---|
| Napoles Maria Agapita | -- | None Available | |
| Napoles Alfredo | $25,000 | None Available | |
| Rivera Ignacio Jimenez | -- | None Available |
Source: Public Records
Tax History
| Year | Tax Paid | Tax Assessment Tax Assessment Total Assessment is a certain percentage of the fair market value that is determined by local assessors to be the total taxable value of land and additions on the property. | Land | Improvement |
|---|---|---|---|---|
| 2025 | $772 | $54,168 | $18,468 | $35,700 |
| 2024 | $747 | $53,107 | $18,106 | $35,001 |
| 2023 | $747 | $52,067 | $17,751 | $34,316 |
| 2022 | $730 | $51,047 | $17,403 | $33,644 |
| 2021 | $669 | $50,047 | $17,062 | $32,985 |
| 2020 | $654 | $49,536 | $16,888 | $32,648 |
| 2019 | $644 | $49,536 | $16,888 | $32,648 |
| 2018 | $636 | $47,615 | $16,233 | $31,382 |
| 2017 | $640 | $46,682 | $15,915 | $30,767 |
| 2016 | $631 | $45,767 | $15,603 | $30,164 |
| 2015 | $650 | $45,081 | $15,369 | $29,712 |
| 2014 | $610 | $44,199 | $15,068 | $29,131 |
Source: Public Records
Map
Nearby Homes
Your Personal Tour Guide
Ask me questions while you tour the home.