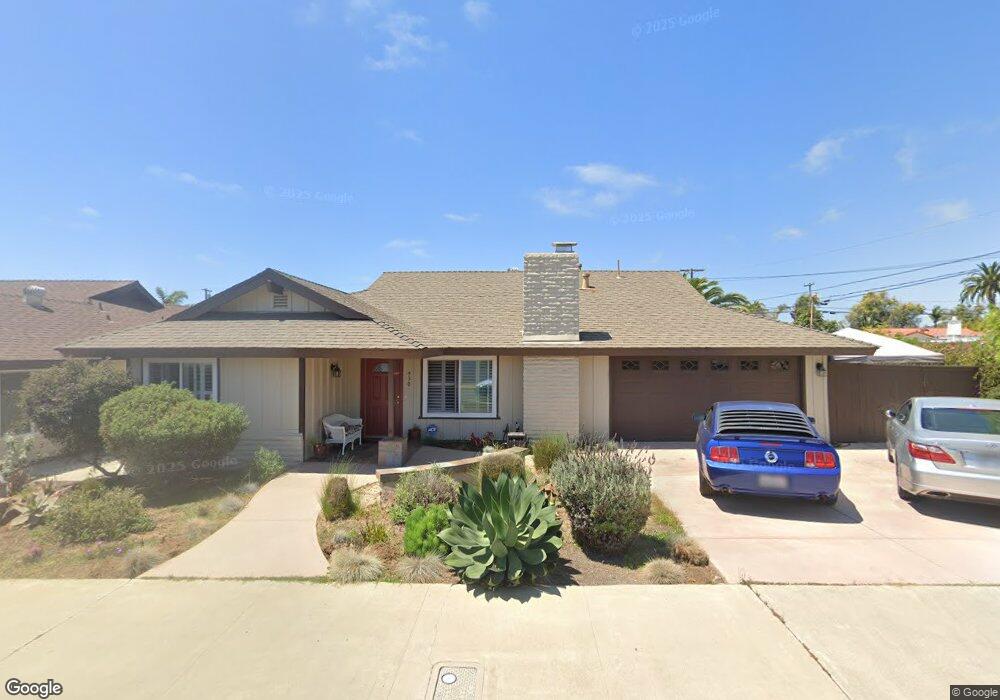
930 Horne Place Oceanside, CA 92054
South Oceanside NeighborhoodEstimated Value: $1,243,000 - $1,468,000
4
Beds
2
Baths
1,580
Sq Ft
$873/Sq Ft
Est. Value
About This Home
This home is located at 930 Horne Place, Oceanside, CA 92054 and is currently estimated at $1,378,885, approximately $872 per square foot. 930 Horne Place is a home located in San Diego County with nearby schools including South Oceanside Elementary School, Lincoln Middle School, and Oceanside High School.
Ownership History
Date
Name
Owned For
Owner Type
Purchase Details
Closed on
May 29, 2020
Sold by
Kirk Jeffrey Raymond and Kirk Jeffrey
Bought by
Kirk Jeffrey and Captain J Kirk Trust
Current Estimated Value
Purchase Details
Closed on
Oct 19, 2016
Sold by
Seyle Nicholas E and Seyle Donna K
Bought by
Kirk Jeffrey Raymond
Home Financials for this Owner
Home Financials are based on the most recent Mortgage that was taken out on this home.
Original Mortgage
$175,500
Outstanding Balance
$80,006
Interest Rate
2.76%
Mortgage Type
New Conventional
Estimated Equity
$1,298,879
Purchase Details
Closed on
Dec 3, 2014
Sold by
Seyle Donna K and Fulton Donna Kirk
Bought by
The Nicholas & Donna Seyle Trust and Seyle Donna K
Purchase Details
Closed on
Feb 20, 1985
Create a Home Valuation Report for This Property
The Home Valuation Report is an in-depth analysis detailing your home's value as well as a comparison with similar homes in the area
Home Values in the Area
Average Home Value in this Area
Purchase History
| Date | Buyer | Sale Price | Title Company |
|---|---|---|---|
| Kirk Jeffrey | -- | None Available | |
| Kirk Jeffrey Raymond | -- | Corinthian Title Company | |
| The Nicholas & Donna Seyle Trust | -- | None Available | |
| -- | $105,000 | -- |
Source: Public Records
Mortgage History
| Date | Status | Borrower | Loan Amount |
|---|---|---|---|
| Open | Kirk Jeffrey Raymond | $175,500 |
Source: Public Records
Tax History Compared to Growth
Tax History
| Year | Tax Paid | Tax Assessment Tax Assessment Total Assessment is a certain percentage of the fair market value that is determined by local assessors to be the total taxable value of land and additions on the property. | Land | Improvement |
|---|---|---|---|---|
| 2025 | $5,022 | $460,590 | $303,357 | $157,233 |
| 2024 | $5,022 | $451,559 | $297,409 | $154,150 |
| 2023 | $4,866 | $442,706 | $291,578 | $151,128 |
| 2022 | $4,791 | $434,026 | $285,861 | $148,165 |
| 2021 | $4,808 | $425,516 | $280,256 | $145,260 |
| 2020 | $4,659 | $421,154 | $277,383 | $143,771 |
| 2019 | $4,523 | $412,897 | $271,945 | $140,952 |
| 2018 | $4,474 | $404,802 | $266,613 | $138,189 |
| 2017 | $4,390 | $396,866 | $261,386 | $135,480 |
| 2016 | $1,949 | $180,134 | $61,543 | $118,591 |
| 2015 | $1,892 | $177,429 | $60,619 | $116,810 |
| 2014 | $1,819 | $173,954 | $59,432 | $114,522 |
Source: Public Records
Map
Nearby Homes
- 1573 Vista Del Mar Way
- 1570 Vista Del Mar Way Unit 4
- 120 Sherri Ln
- 1454 Moreno St
- 1743 S Tremont St
- 35 Parkwood Ln
- 1541 Lauralynn Place
- 1611 Whaley St
- 1519 Kurtz St
- 1445 S Pacific St
- 1409 S Pacific St
- 1324 S Pacific St Unit 4
- 1711 Grandview St
- 1909 S Pacific St
- 1216 S Pacific St
- 1931 S Pacific St
- 555 Eaton St Unit N
- 1121 Makena Way
- 1120 Sea Glass Way
- 2168 S Coast Hwy
- 926 Horne Place
- 929 Morse St
- 925 Morse St
- 920 Horne Place
- 919 Horne Place
- 1003 Morse St
- 919 Morse St
- 931 Horne Place
- 915 Morse St
- 916 Horne Place
- 921 Horne Place
- 1009 Morse St
- 910 Horne Place
- 911 Morse St
- 915 Horne Place
- 923 Horne Place
- 1015 Morse St
- 1015 Morse St Unit A
- 1015 Morse St Unit B
- 930 Morse St