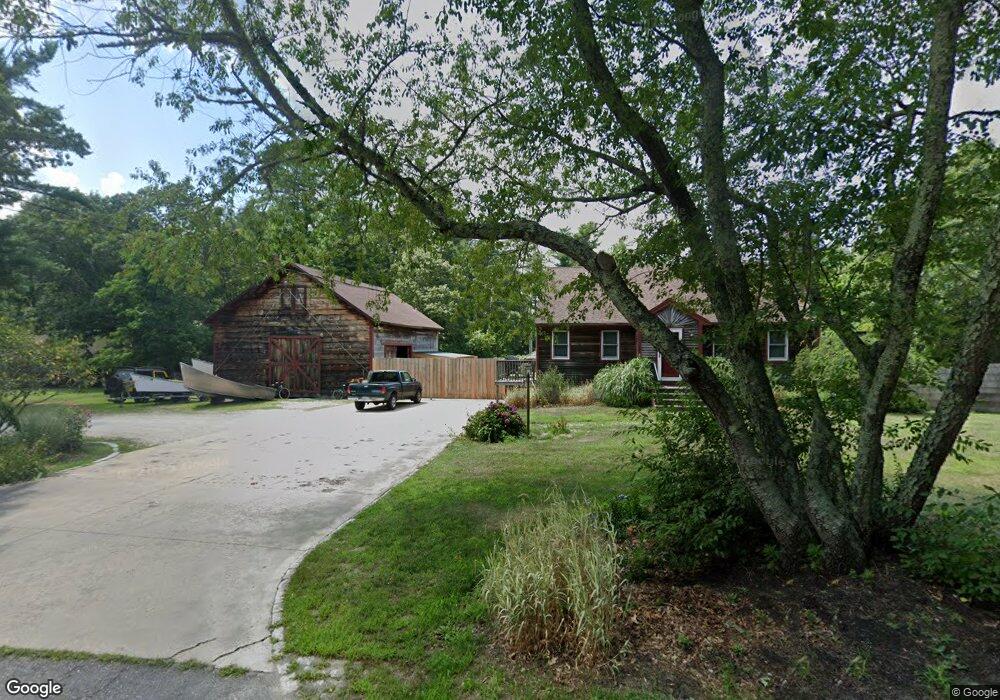
930 Main St West Wareham, MA 02576
Estimated Value: $699,579
Studio
2
Baths
--
Sq Ft
65,340
Sq Ft Lot
About This Home
This home is located at 930 Main St, West Wareham, MA 02576 and is currently estimated at $699,579. 930 Main St is a home located in Plymouth County.
Ownership History
Date
Name
Owned For
Owner Type
Purchase Details
Closed on
Aug 22, 2023
Sold by
Alden Ernest E and Alden Dawn I
Bought by
Lebrun Nathan
Current Estimated Value
Home Financials for this Owner
Home Financials are based on the most recent Mortgage that was taken out on this home.
Original Mortgage
$617,500
Outstanding Balance
$596,588
Interest Rate
5.5%
Mortgage Type
Purchase Money Mortgage
Estimated Equity
$102,991
Purchase Details
Closed on
Apr 29, 1996
Sold by
Callahan Club Inc
Bought by
Alden Ernest E and Meehan Dawn I
Create a Home Valuation Report for This Property
The Home Valuation Report is an in-depth analysis detailing your home's value as well as a comparison with similar homes in the area
Home Values in the Area
Average Home Value in this Area
Purchase History
| Date | Buyer | Sale Price | Title Company |
|---|---|---|---|
| Lebrun Nathan | $650,000 | None Available | |
| Lebrun Nathan | $650,000 | None Available | |
| Alden Ernest E | $41,000 | -- | |
| Alden Ernest E | $41,000 | -- |
Source: Public Records
Mortgage History
| Date | Status | Borrower | Loan Amount |
|---|---|---|---|
| Open | Lebrun Nathan | $617,500 | |
| Closed | Lebrun Nathan | $617,500 | |
| Previous Owner | Alden Ernest E | $18,300 | |
| Previous Owner | Alden Ernest E | $340,000 | |
| Previous Owner | Alden Ernest E | $330,000 |
Source: Public Records
Tax History
| Year | Tax Paid | Tax Assessment Tax Assessment Total Assessment is a certain percentage of the fair market value that is determined by local assessors to be the total taxable value of land and additions on the property. | Land | Improvement |
|---|---|---|---|---|
| 2025 | $6,760 | $648,800 | $140,600 | $508,200 |
| 2024 | $6,484 | $577,400 | $112,800 | $464,600 |
| 2023 | $6,187 | $514,300 | $102,700 | $411,600 |
| 2022 | $5,869 | $445,300 | $102,700 | $342,600 |
| 2021 | $5,680 | $422,300 | $102,700 | $319,600 |
| 2020 | $5,539 | $417,700 | $102,700 | $315,000 |
| 2019 | $5,220 | $392,800 | $108,500 | $284,300 |
| 2018 | $5,188 | $380,600 | $108,500 | $272,100 |
| 2017 | $4,729 | $351,600 | $108,500 | $243,100 |
| 2016 | $4,630 | $342,200 | $113,700 | $228,500 |
| 2015 | $4,029 | $308,300 | $113,700 | $194,600 |
| 2014 | $4,462 | $347,200 | $113,700 | $233,500 |
Source: Public Records
Map
Nearby Homes
Your Personal Tour Guide
Ask me questions while you tour the home.