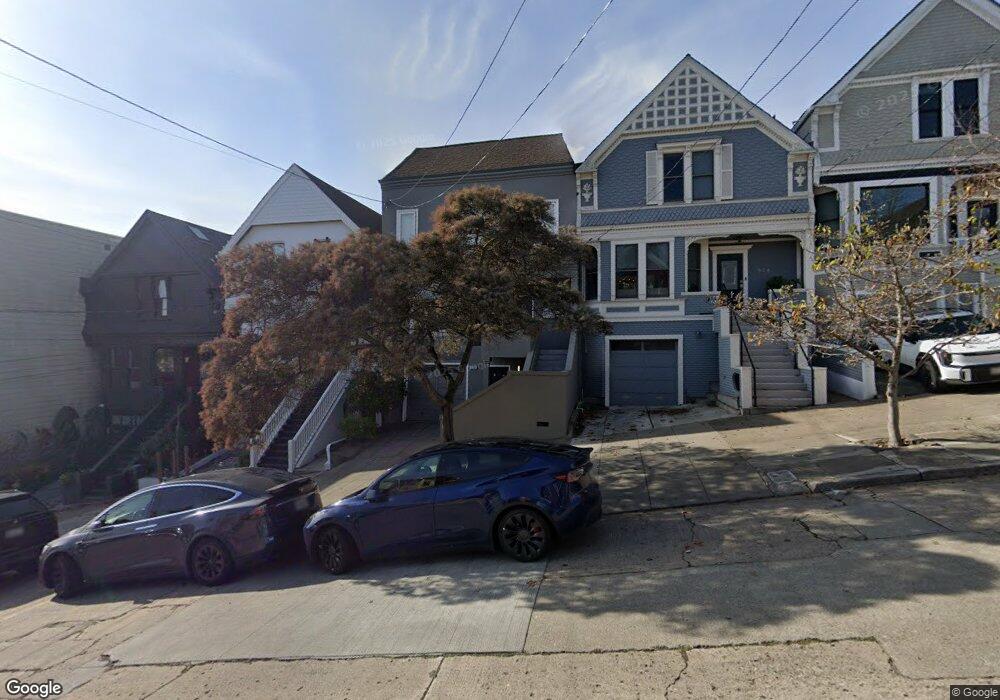
930 Noe St San Francisco, CA 94114
Noe Valley NeighborhoodEstimated Value: $3,056,000 - $4,460,000
4
Beds
4
Baths
2,750
Sq Ft
$1,391/Sq Ft
Est. Value
About This Home
This home is located at 930 Noe St, San Francisco, CA 94114 and is currently estimated at $3,824,070, approximately $1,390 per square foot. 930 Noe St is a home located in San Francisco County with nearby schools including Harvey Milk Civil Rights Academy, Everett Middle School, and Thomas Edison Charter Academy.
Ownership History
Date
Name
Owned For
Owner Type
Purchase Details
Closed on
Apr 17, 2019
Sold by
Varian John and Varian Debra
Bought by
Julia O Dwyer and Dwyer Ross A O
Current Estimated Value
Home Financials for this Owner
Home Financials are based on the most recent Mortgage that was taken out on this home.
Original Mortgage
$3,494
Outstanding Balance
$3,078
Interest Rate
4.4%
Mortgage Type
Purchase Money Mortgage
Estimated Equity
$3,820,992
Purchase Details
Closed on
Sep 8, 1998
Sold by
Kavanaugh James A
Bought by
Varian John and Varian Debra
Home Financials for this Owner
Home Financials are based on the most recent Mortgage that was taken out on this home.
Original Mortgage
$475,000
Interest Rate
7.12%
Purchase Details
Closed on
Mar 4, 1998
Sold by
Jefferson Rebecca L and Jefferson Larry D
Bought by
Kavanaugh James A
Home Financials for this Owner
Home Financials are based on the most recent Mortgage that was taken out on this home.
Original Mortgage
$320,000
Interest Rate
4.95%
Create a Home Valuation Report for This Property
The Home Valuation Report is an in-depth analysis detailing your home's value as well as a comparison with similar homes in the area
Home Values in the Area
Average Home Value in this Area
Purchase History
| Date | Buyer | Sale Price | Title Company |
|---|---|---|---|
| Julia O Dwyer | $3,600,000 | Fidelity Title Co Concord | |
| Varian John | $830,000 | First American Title Co | |
| Kavanaugh James A | $400,000 | First American Title Co |
Source: Public Records
Mortgage History
| Date | Status | Borrower | Loan Amount |
|---|---|---|---|
| Open | Julia O Dwyer | $3,494 | |
| Previous Owner | Varian John | $475,000 | |
| Previous Owner | Kavanaugh James A | $320,000 |
Source: Public Records
Tax History Compared to Growth
Tax History
| Year | Tax Paid | Tax Assessment Tax Assessment Total Assessment is a certain percentage of the fair market value that is determined by local assessors to be the total taxable value of land and additions on the property. | Land | Improvement |
|---|---|---|---|---|
| 2025 | $46,910 | $4,015,863 | $2,811,105 | $1,204,758 |
| 2024 | $46,910 | $3,937,122 | $2,755,986 | $1,181,136 |
| 2023 | $46,224 | $3,859,925 | $2,701,948 | $1,157,977 |
| 2022 | $45,377 | $3,784,241 | $2,648,969 | $1,135,272 |
| 2021 | $44,584 | $3,710,041 | $2,597,029 | $1,113,012 |
| 2020 | $44,798 | $3,672,000 | $2,570,400 | $1,101,600 |
| 2019 | $14,453 | $1,166,451 | $562,145 | $604,306 |
| 2018 | $13,962 | $1,143,580 | $551,123 | $592,457 |
| 2017 | $13,498 | $1,121,158 | $540,317 | $580,841 |
| 2016 | $13,271 | $1,099,175 | $529,723 | $569,452 |
| 2015 | $13,103 | $1,082,666 | $521,767 | $560,899 |
| 2014 | $12,757 | $1,061,459 | $511,547 | $549,912 |
Source: Public Records
Map
Nearby Homes
- 891 Noe St
- 1026 Castro St
- 857 Castro St
- 4121 23rd St
- 3879 23rd St
- 260 Jersey St
- 222 Jersey St
- 376 Hill St
- 228 Vicksburg St Unit 2
- 228 Vicksburg St Unit 3
- 4031 22nd St
- 734 Elizabeth St
- 1161 Church St
- 433 Eureka St
- 4234 24th St
- 335 Diamond St
- 671 Douglass St
- 269A Chattanooga St
- 308 Diamond St
- 3960 20th St