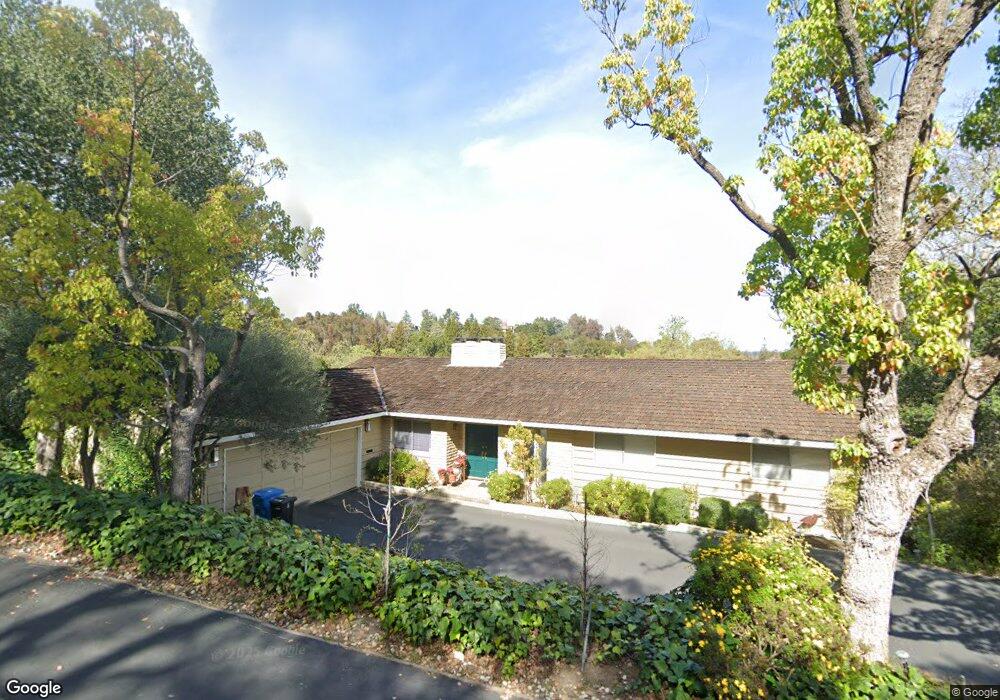
930 Siskiyou Dr Menlo Park, CA 94025
Sharon Heights NeighborhoodEstimated Value: $2,804,000 - $4,371,000
5
Beds
4
Baths
2,080
Sq Ft
$1,727/Sq Ft
Est. Value
About This Home
This home is located at 930 Siskiyou Dr, Menlo Park, CA 94025 and is currently estimated at $3,592,222, approximately $1,727 per square foot. 930 Siskiyou Dr is a home located in San Mateo County with nearby schools including Las Lomitas Elementary School, La Entrada Middle School, and Menlo-Atherton High School.
Ownership History
Date
Name
Owned For
Owner Type
Purchase Details
Closed on
Sep 22, 2020
Sold by
Wender Paul A and Wender Jacqueline B
Bought by
Wender Paul A and Wender Jacqueline B
Current Estimated Value
Purchase Details
Closed on
Nov 8, 1995
Sold by
Roberts Lynn Wilson
Bought by
Wender Paul Anthony and Wender Jacqueline Bryan
Home Financials for this Owner
Home Financials are based on the most recent Mortgage that was taken out on this home.
Original Mortgage
$325,000
Interest Rate
7.15%
Purchase Details
Closed on
Feb 15, 1994
Sold by
Trick Mary M
Bought by
Roberts Lynn Wilson
Home Financials for this Owner
Home Financials are based on the most recent Mortgage that was taken out on this home.
Original Mortgage
$551,200
Interest Rate
6.45%
Create a Home Valuation Report for This Property
The Home Valuation Report is an in-depth analysis detailing your home's value as well as a comparison with similar homes in the area
Home Values in the Area
Average Home Value in this Area
Purchase History
| Date | Buyer | Sale Price | Title Company |
|---|---|---|---|
| Wender Paul A | -- | None Available | |
| Wender Paul A | -- | None Available | |
| Wender Paul Anthony | $725,000 | North American Title Co | |
| Roberts Lynn Wilson | -- | First American Title Ins Co |
Source: Public Records
Mortgage History
| Date | Status | Borrower | Loan Amount |
|---|---|---|---|
| Closed | Wender Paul Anthony | $325,000 | |
| Previous Owner | Roberts Lynn Wilson | $551,200 | |
| Closed | Roberts Lynn Wilson | $68,900 |
Source: Public Records
Tax History Compared to Growth
Tax History
| Year | Tax Paid | Tax Assessment Tax Assessment Total Assessment is a certain percentage of the fair market value that is determined by local assessors to be the total taxable value of land and additions on the property. | Land | Improvement |
|---|---|---|---|---|
| 2025 | $14,881 | $1,204,402 | $602,201 | $602,201 |
| 2023 | $14,881 | $1,157,636 | $578,818 | $578,818 |
| 2022 | $14,204 | $1,134,938 | $567,469 | $567,469 |
| 2021 | $13,985 | $1,112,686 | $556,343 | $556,343 |
| 2020 | $13,724 | $1,101,278 | $550,639 | $550,639 |
| 2019 | $14,049 | $1,079,686 | $539,843 | $539,843 |
| 2018 | $13,390 | $1,058,516 | $529,258 | $529,258 |
| 2017 | $12,935 | $1,037,762 | $518,881 | $518,881 |
| 2016 | $12,818 | $1,017,414 | $508,707 | $508,707 |
| 2015 | $12,559 | $1,002,132 | $501,066 | $501,066 |
| 2014 | $12,444 | $982,502 | $491,251 | $491,251 |
Source: Public Records
Map
Nearby Homes
- 927 Continental Dr
- 955 Monte Rosa Dr
- 935 Monte Rosa Dr
- 675 Sharon Park Dr Unit 245
- 1230 Sharon Park Dr Unit 55
- 700 Sand Hill Cir
- 1350 Trinity Dr
- 170 Sand Hill Cir
- 1360 Trinity Dr
- 1265 Trinity Dr
- 2 Hallmark Cir
- 402 Sand Hill Cir
- 2138 Avy Ave
- 416 Sand Hill Cir
- 504 Sand Hill Cir
- 2171 Clayton Dr
- 89 Tallwood Ct
- 2140 Monterey Ave
- 2051 Gordon Ave
- 1 Tallwood Ct
- 924 Siskiyou Dr
- 940 Siskiyou Dr
- 929 Siskiyou Dr
- 935 Siskiyou Dr
- 918 Siskiyou Dr
- 950 Siskiyou Dr
- 925 Siskiyou Dr
- 945 Siskiyou Dr
- 921 Siskiyou Dr
- 910 Siskiyou Dr
- 960 Siskiyou Dr
- 915 Siskiyou Dr
- 955 Siskiyou Dr
- 900 Siskiyou Dr
- 909 Siskiyou Dr
- 970 Siskiyou Dr
- 3 Siskiyou Place
- 901 Siskiyou Dr
- 980 Siskiyou Dr
- 4 Sunset Ln