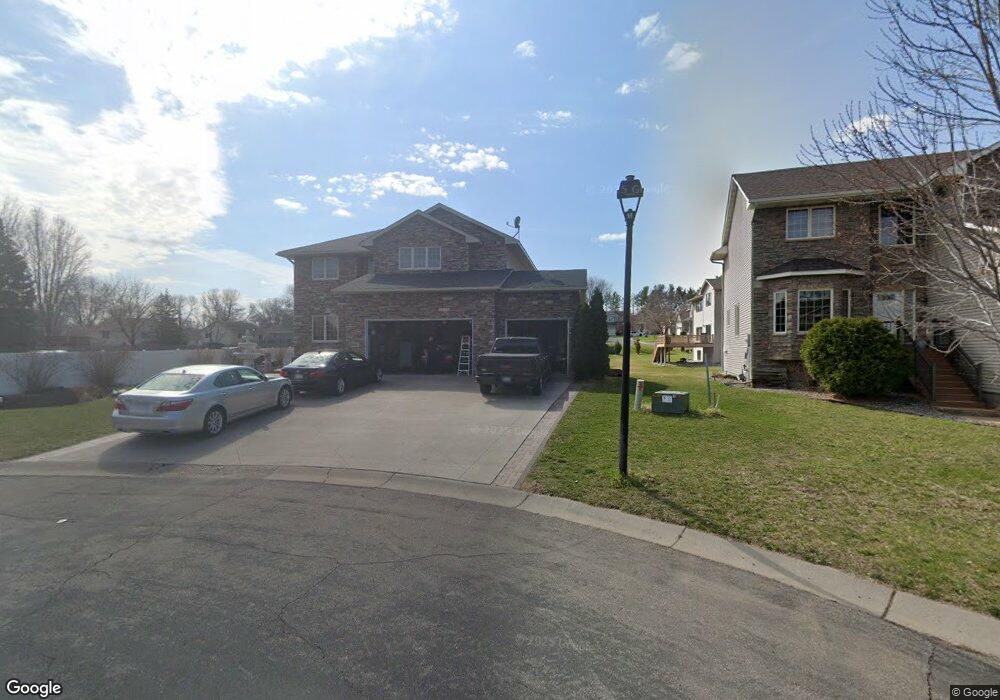
9307 Minnesota Ln N Maple Grove, MN 55369
Estimated Value: $515,475 - $560,000
4
Beds
3
Baths
2,578
Sq Ft
$210/Sq Ft
Est. Value
About This Home
This home is located at 9307 Minnesota Ln N, Maple Grove, MN 55369 and is currently estimated at $540,119, approximately $209 per square foot. 9307 Minnesota Ln N is a home located in Hennepin County with nearby schools including Fernbrook Elementary School, Osseo Middle School, and Maple Grove Senior High School.
Ownership History
Date
Name
Owned For
Owner Type
Purchase Details
Closed on
Sep 26, 2015
Sold by
Sayamvixay Vivanh and Sayamvixay Viengvilay
Bought by
Sayamvixay Vivanh and Sayamvixay Viengvilay
Current Estimated Value
Home Financials for this Owner
Home Financials are based on the most recent Mortgage that was taken out on this home.
Original Mortgage
$289,829
Outstanding Balance
$206,896
Interest Rate
4.12%
Mortgage Type
FHA
Estimated Equity
$333,223
Purchase Details
Closed on
Oct 20, 2008
Sold by
Westman Christopher A and Westman Kim
Bought by
Sayamuixay Vivanh and Chanthavong Viengvilay
Purchase Details
Closed on
May 7, 2007
Sold by
Contractors Capital Corp
Bought by
Westman Christopher A
Create a Home Valuation Report for This Property
The Home Valuation Report is an in-depth analysis detailing your home's value as well as a comparison with similar homes in the area
Home Values in the Area
Average Home Value in this Area
Purchase History
| Date | Buyer | Sale Price | Title Company |
|---|---|---|---|
| Sayamvixay Vivanh | -- | Transtar National Title | |
| Sayamuixay Vivanh | $315,000 | -- | |
| Westman Christopher A | $310,000 | -- |
Source: Public Records
Mortgage History
| Date | Status | Borrower | Loan Amount |
|---|---|---|---|
| Open | Sayamvixay Vivanh | $289,829 |
Source: Public Records
Tax History Compared to Growth
Tax History
| Year | Tax Paid | Tax Assessment Tax Assessment Total Assessment is a certain percentage of the fair market value that is determined by local assessors to be the total taxable value of land and additions on the property. | Land | Improvement |
|---|---|---|---|---|
| 2024 | $5,825 | $481,500 | $98,200 | $383,300 |
| 2023 | $5,455 | $465,100 | $74,600 | $390,500 |
| 2022 | $4,741 | $476,300 | $74,600 | $401,700 |
| 2021 | $4,526 | $392,200 | $60,600 | $331,600 |
| 2020 | $4,632 | $369,900 | $49,000 | $320,900 |
| 2019 | $4,699 | $360,200 | $49,000 | $311,200 |
| 2018 | $4,694 | $346,100 | $48,000 | $298,100 |
| 2017 | $4,629 | $322,700 | $48,000 | $274,700 |
| 2016 | $4,688 | $322,200 | $48,000 | $274,200 |
| 2015 | $4,683 | $313,900 | $48,000 | $265,900 |
| 2014 | -- | $282,400 | $48,000 | $234,400 |
Source: Public Records
Map
Nearby Homes
- 9340 Ranchview Ln N
- 9536 Minnesota Ln N
- 14661 94th Place N
- 14624 92nd Place N
- 10625 Juneau Ln N
- 14878 95th Place N
- 14402 91st Place N
- 9421 Dallas Ln N
- 13885 93rd Place N
- 9228 Archer Ln N
- 13744 94th Ave N
- 9190 Archer Ln N
- 9115 Archer Ln N
- 9138 Comstock Ln N Unit 204
- 9150 Comstock Ln N
- 8566 Quarles Rd
- 9828 Zinnia Ln N
- 13590 89th Ave N
- 8858 Comstock Ct
- 9061 Underwood Ln N
- 9317 Minnesota Ln N
- 9340 Niagara Ln N
- 9334 Niagara Ln N
- 9327 Minnesota Ln N
- 15064 92nd Place N
- 15084 92nd Place N
- 15024 92nd Place N
- 15104 92nd Place N
- 9308 Minnesota Ln N
- 9335 Niagara Ln N
- 15057 93rd Place N
- 15004 92nd Place N
- 9318 Minnesota Ln N
- 15087 93rd Place N
- 15027 93rd Place N
- 15124 92nd Place N
- 9328 Minnesota Ln N
- 9319 Niagara Ln N
- 14984 92nd Place N
- 15139 93rd Place N