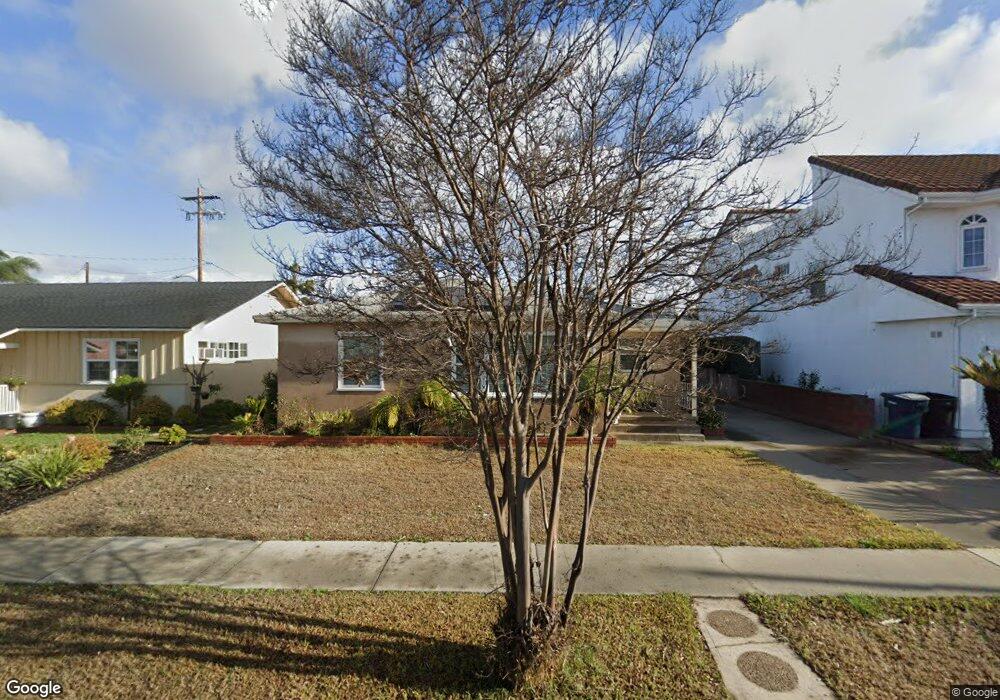
9309 Prichard St Bellflower, CA 90706
Estimated Value: $803,867 - $915,000
3
Beds
2
Baths
1,440
Sq Ft
$585/Sq Ft
Est. Value
About This Home
This home is located at 9309 Prichard St, Bellflower, CA 90706 and is currently estimated at $841,967, approximately $584 per square foot. 9309 Prichard St is a home located in Los Angeles County with nearby schools including Albert Baxter Elementary School, Bellflower High School, and Adventist Union School.
Ownership History
Date
Name
Owned For
Owner Type
Purchase Details
Closed on
Oct 7, 2024
Sold by
Hokia Hilton T
Bought by
Hokia Living Trust and Hokia
Current Estimated Value
Purchase Details
Closed on
Dec 11, 1998
Sold by
Hokia Hilton T
Bought by
Hokia Hilton T
Home Financials for this Owner
Home Financials are based on the most recent Mortgage that was taken out on this home.
Original Mortgage
$154,000
Interest Rate
6.86%
Purchase Details
Closed on
Oct 10, 1998
Sold by
Hokia Caroline Yu
Bought by
Hokia Hilton T
Purchase Details
Closed on
Mar 18, 1997
Sold by
Jones Robert
Bought by
Hokia Hilton T
Home Financials for this Owner
Home Financials are based on the most recent Mortgage that was taken out on this home.
Original Mortgage
$150,620
Interest Rate
7.86%
Mortgage Type
FHA
Purchase Details
Closed on
Jul 17, 1996
Sold by
Jones Robert L
Bought by
Jones Robert L and Jones Marlene
Home Financials for this Owner
Home Financials are based on the most recent Mortgage that was taken out on this home.
Original Mortgage
$107,250
Interest Rate
4.25%
Create a Home Valuation Report for This Property
The Home Valuation Report is an in-depth analysis detailing your home's value as well as a comparison with similar homes in the area
Home Values in the Area
Average Home Value in this Area
Purchase History
| Date | Buyer | Sale Price | Title Company |
|---|---|---|---|
| Hokia Living Trust | -- | None Listed On Document | |
| Hokia Hilton T | -- | Chicago Title Co | |
| Hokia Hilton T | -- | Chicago Title Co | |
| Hokia Hilton T | $155,000 | California Counties Title Co | |
| Jones Robert L | -- | Stewart Title |
Source: Public Records
Mortgage History
| Date | Status | Borrower | Loan Amount |
|---|---|---|---|
| Previous Owner | Hokia Hilton T | $154,000 | |
| Previous Owner | Hokia Hilton T | $150,620 | |
| Previous Owner | Jones Robert L | $107,250 |
Source: Public Records
Tax History Compared to Growth
Tax History
| Year | Tax Paid | Tax Assessment Tax Assessment Total Assessment is a certain percentage of the fair market value that is determined by local assessors to be the total taxable value of land and additions on the property. | Land | Improvement |
|---|---|---|---|---|
| 2025 | $3,287 | $252,417 | $136,470 | $115,947 |
| 2024 | $3,287 | $247,469 | $133,795 | $113,674 |
| 2023 | $3,163 | $242,618 | $131,172 | $111,446 |
| 2022 | $3,104 | $237,861 | $128,600 | $109,261 |
| 2021 | $3,037 | $233,198 | $126,079 | $107,119 |
| 2019 | $2,958 | $226,284 | $122,341 | $103,943 |
| 2018 | $2,799 | $221,848 | $119,943 | $101,905 |
| 2016 | $2,673 | $213,236 | $115,287 | $97,949 |
| 2015 | $2,618 | $210,034 | $113,556 | $96,478 |
| 2014 | $2,586 | $205,921 | $111,332 | $94,589 |
Source: Public Records
Map
Nearby Homes
- 9229 Mandale St
- 9494 Van Ruiten St
- 13440 Lakewood Blvd Unit 99
- 13440 Lakewood Blvd Unit 98
- 13440 Lakewood Blvd Unit 97
- 13742 Hanwell Ave
- 9564 Rosecrans Ave
- 9127 Hargill St
- 9226 Foster Rd
- 9545 Heiner St
- 9488 Foster Rd
- 9003 Mapleside St
- 13522 Ardis Ave
- 15154 Oliva Ave
- 9837 Belfair St
- 8554 Elburg St Unit C
- 8600 Contreras St Unit 27
- 8600 Contreras St Unit 68
- 8808 Paseo St
- 15156 Bellota Ave
- 9313 Prichard St
- 9303 Prichard St
- 14400 Cerritos Ave
- 9319 Prichard St
- 14332 Cerritos Ave
- 9323 Prichard St
- 9306 Prichard St
- 9312 Prichard St
- 9300 Prichard St
- 14328 Cerritos Ave
- 9316 Prichard St
- 14415 Cerritos Ave
- 14409 Cerritos Ave
- 9331 Prichard St
- 14405 Cerritos Ave
- 9320 Prichard St
- 14324 Cerritos Ave
- 14421 Cerritos Ave
- 14333 Cerritos Ave
- 9326 Prichard St