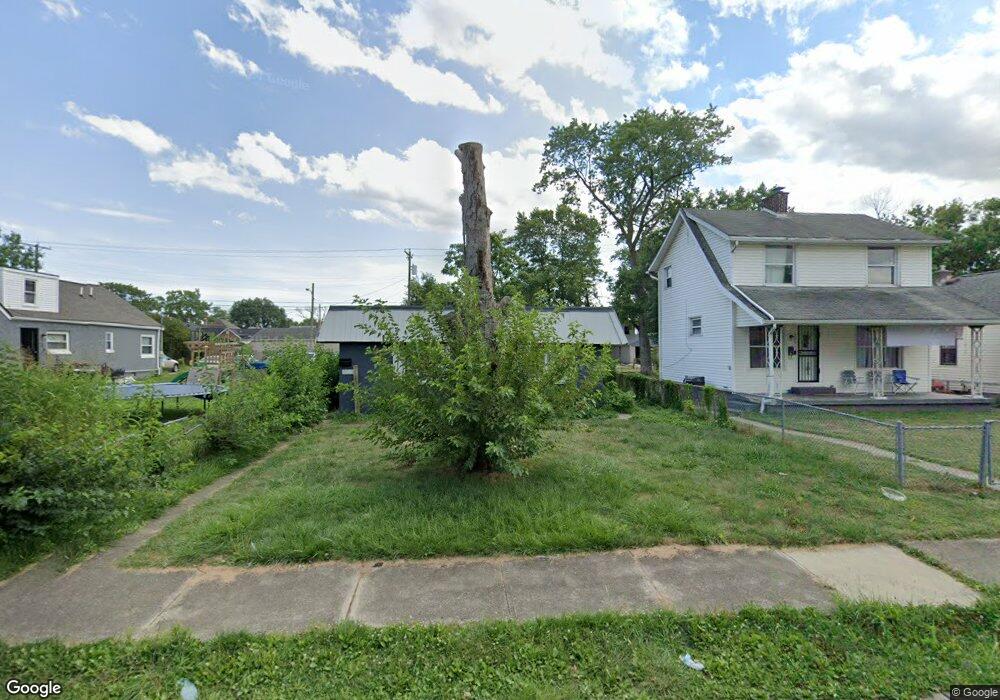
931 E 18th Ave Unit 933 Columbus, OH 43211
South Linden NeighborhoodEstimated Value: $150,173 - $184,000
4
Beds
2
Baths
1,904
Sq Ft
$91/Sq Ft
Est. Value
About This Home
This home is located at 931 E 18th Ave Unit 933, Columbus, OH 43211 and is currently estimated at $172,793, approximately $90 per square foot. 931 E 18th Ave Unit 933 is a home located in Franklin County with nearby schools including Linden-Mckinley Stem School On Arcadia, North Columbus Preparatory Academy, and Graham Elementary and Middle School.
Ownership History
Date
Name
Owned For
Owner Type
Purchase Details
Closed on
Apr 30, 2010
Sold by
Fannie Mae
Bought by
Plaskett Patrick
Current Estimated Value
Purchase Details
Closed on
Oct 13, 2009
Sold by
Holmes Elisha
Bought by
Federal National Mortgage Association
Purchase Details
Closed on
Aug 15, 2003
Sold by
Burt David K and Burt Valerie Y
Bought by
Holmes Elisha R
Home Financials for this Owner
Home Financials are based on the most recent Mortgage that was taken out on this home.
Original Mortgage
$67,500
Interest Rate
5.69%
Mortgage Type
Purchase Money Mortgage
Purchase Details
Closed on
Oct 5, 1999
Sold by
Tribb Corp
Bought by
Burt David K and Burt Valerie Y
Home Financials for this Owner
Home Financials are based on the most recent Mortgage that was taken out on this home.
Original Mortgage
$97,000
Interest Rate
9.75%
Mortgage Type
Purchase Money Mortgage
Purchase Details
Closed on
Jun 17, 1993
Purchase Details
Closed on
Aug 22, 1989
Create a Home Valuation Report for This Property
The Home Valuation Report is an in-depth analysis detailing your home's value as well as a comparison with similar homes in the area
Home Values in the Area
Average Home Value in this Area
Purchase History
| Date | Buyer | Sale Price | Title Company |
|---|---|---|---|
| Plaskett Patrick | $15,000 | Accutitle Agency Inc | |
| Federal National Mortgage Association | $26,000 | None Available | |
| Holmes Elisha R | $75,000 | Capcity Title | |
| Burt David K | $121,300 | -- | |
| Tribb Group | $41,000 | -- | |
| -- | -- | -- | |
| -- | $19,700 | -- |
Source: Public Records
Mortgage History
| Date | Status | Borrower | Loan Amount |
|---|---|---|---|
| Previous Owner | Holmes Elisha R | $67,500 | |
| Previous Owner | Burt David K | $97,000 |
Source: Public Records
Tax History
| Year | Tax Paid | Tax Assessment Tax Assessment Total Assessment is a certain percentage of the fair market value that is determined by local assessors to be the total taxable value of land and additions on the property. | Land | Improvement |
|---|---|---|---|---|
| 2025 | $1,972 | $43,470 | $5,180 | $38,290 |
| 2024 | $1,972 | $43,470 | $5,180 | $38,290 |
| 2023 | $2,097 | $43,470 | $5,180 | $38,290 |
| 2022 | $972 | $15,650 | $2,490 | $13,160 |
| 2021 | $1,348 | $15,650 | $2,490 | $13,160 |
| 2020 | $974 | $15,650 | $2,490 | $13,160 |
| 2019 | $950 | $13,030 | $2,070 | $10,960 |
| 2018 | $603 | $13,030 | $2,070 | $10,960 |
| 2017 | $576 | $13,030 | $2,070 | $10,960 |
| 2016 | $1,235 | $15,510 | $3,010 | $12,500 |
| 2015 | $626 | $15,510 | $3,010 | $12,500 |
| 2014 | $948 | $15,510 | $3,010 | $12,500 |
| 2013 | $530 | $17,220 | $3,325 | $13,895 |
Source: Public Records
Map
Nearby Homes
- 906 E 18th Ave
- 0 E 18th Ave
- 269 E 18th Ave
- 957 E 17th Ave
- 1705 Lexington Ave
- 1012 E 17th Ave
- 990 E 16th Ave
- 1037 E 18th Ave
- 1045-1051 E 20th Ave
- 1078 E 19th Ave
- 1070 E 16th Ave
- 1033 E 22nd Ave
- 1129 E 17th Ave
- 1027 E 14th Ave
- 1111-1113 E 16th Ave
- 915 E 13th Ave
- 1157-1159 E 18th Ave
- 1136 E 21st Ave
- 957 E 13th Ave
- 1673 Cleveland Ave
- 931-933 E 18th Ave
- 927 E 18th Ave
- 923 E 18th Ave
- 941 E 18th Ave
- 919 E 18th Ave
- 947 E 18th Ave
- 915 E 18th Ave
- 951 E 18th Ave
- 0 E Seventeenth Ave
- 920 E 17th Ave Unit 922
- 920-922 E 17th Ave
- 930 E 17th Ave
- 914 E 17th Ave Unit 916
- 914 E Ns 17th Ave Unit 914-916
- 909 E 18th Ave
- 955 E 18th Ave
- 922 E 17th Ave
- 934 E 18th Ave
- 938 E 18th Ave Unit 940
- 938 E 18th Ave Unit 40
Your Personal Tour Guide
Ask me questions while you tour the home.