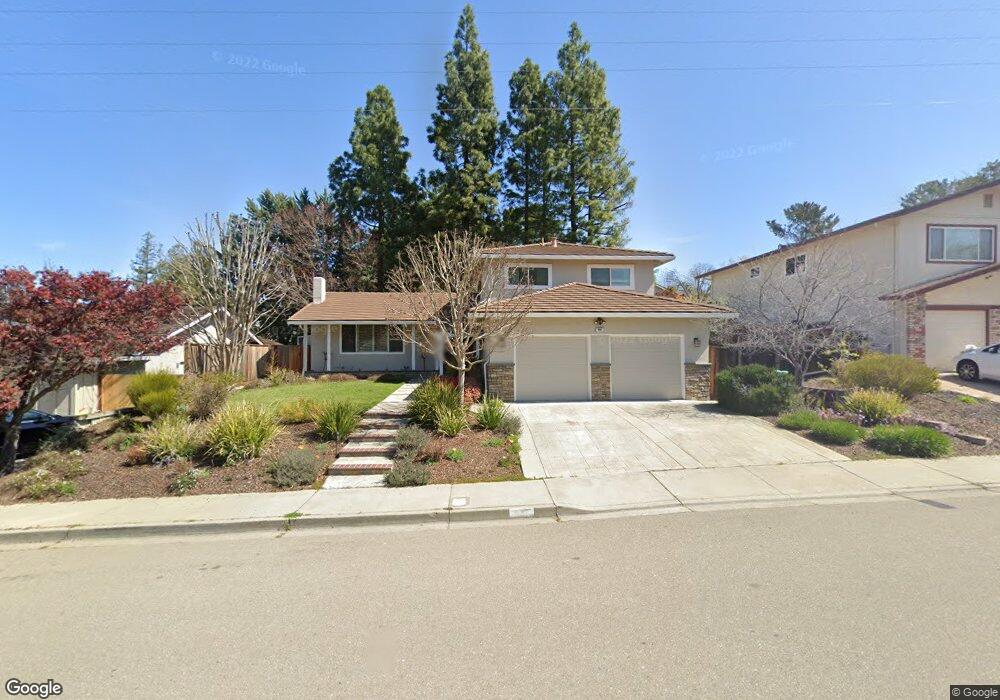
932 Concord St Pleasanton, CA 94566
Vintage Hills NeighborhoodEstimated Value: $1,693,000 - $1,950,000
4
Beds
3
Baths
2,303
Sq Ft
$789/Sq Ft
Est. Value
About This Home
This home is located at 932 Concord St, Pleasanton, CA 94566 and is currently estimated at $1,817,983, approximately $789 per square foot. 932 Concord St is a home located in Alameda County with nearby schools including Vintage Hills Elementary School, Pleasanton Middle School, and Amador Valley High School.
Ownership History
Date
Name
Owned For
Owner Type
Purchase Details
Closed on
Jun 24, 2020
Sold by
Mammini Paul V and Mammini Jennifer A
Bought by
Mammini Paul V and Mammini Jennifer A
Current Estimated Value
Home Financials for this Owner
Home Financials are based on the most recent Mortgage that was taken out on this home.
Original Mortgage
$658,300
Outstanding Balance
$522,796
Interest Rate
3.1%
Mortgage Type
New Conventional
Estimated Equity
$1,295,187
Purchase Details
Closed on
May 28, 2009
Sold by
Wagerman Kirk A and Wagerman Lori A
Bought by
Wagerman Kirk A and Wagerman Lori A
Purchase Details
Closed on
Mar 19, 2008
Sold by
Wagerman Kirk A and Wagerman Lori A
Bought by
Mammini Paul V and Mammini Jennifer A
Home Financials for this Owner
Home Financials are based on the most recent Mortgage that was taken out on this home.
Original Mortgage
$720,000
Interest Rate
5.62%
Mortgage Type
Purchase Money Mortgage
Purchase Details
Closed on
Dec 5, 2001
Sold by
Hageman Karl and Hageman Jennifer Kelso
Bought by
Wagerman Kirk A and Wagerman Lori A
Home Financials for this Owner
Home Financials are based on the most recent Mortgage that was taken out on this home.
Original Mortgage
$462,000
Interest Rate
6.67%
Create a Home Valuation Report for This Property
The Home Valuation Report is an in-depth analysis detailing your home's value as well as a comparison with similar homes in the area
Home Values in the Area
Average Home Value in this Area
Purchase History
| Date | Buyer | Sale Price | Title Company |
|---|---|---|---|
| Mammini Paul V | -- | Chicago Title Company | |
| Wagerman Kirk A | -- | None Available | |
| Mammini Paul V | $900,000 | Fidelity National Title Comp | |
| Wagerman Kirk A | $577,500 | Old Republic Title Company |
Source: Public Records
Mortgage History
| Date | Status | Borrower | Loan Amount |
|---|---|---|---|
| Open | Mammini Paul V | $658,300 | |
| Closed | Mammini Paul V | $720,000 | |
| Previous Owner | Wagerman Kirk A | $462,000 | |
| Closed | Wagerman Kirk A | $57,750 |
Source: Public Records
Tax History
| Year | Tax Paid | Tax Assessment Tax Assessment Total Assessment is a certain percentage of the fair market value that is determined by local assessors to be the total taxable value of land and additions on the property. | Land | Improvement |
|---|---|---|---|---|
| 2025 | $13,645 | $1,182,086 | $354,626 | $827,460 |
| 2024 | $13,645 | $1,158,911 | $347,673 | $811,238 |
| 2023 | $13,490 | $1,136,195 | $340,858 | $795,337 |
| 2022 | $12,779 | $1,113,920 | $334,176 | $779,744 |
| 2021 | $12,452 | $1,092,086 | $327,626 | $764,460 |
| 2020 | $12,294 | $1,080,890 | $324,267 | $756,623 |
| 2019 | $12,445 | $1,059,704 | $317,911 | $741,793 |
| 2018 | $12,194 | $1,038,932 | $311,679 | $727,253 |
| 2017 | $11,882 | $1,018,565 | $305,569 | $712,996 |
| 2016 | $10,973 | $998,594 | $299,578 | $699,016 |
| 2015 | $10,768 | $983,600 | $295,080 | $688,520 |
| 2014 | $9,411 | $827,000 | $248,100 | $578,900 |
Source: Public Records
Map
Nearby Homes
- 691 Concord Place
- 601 Palomino Dr Unit D
- 3375 Norton Way Unit 5
- 389 Mavis Dr
- 4262 Tamur Ct
- 3436 Smoketree Commons
- 327 Linden Way
- 215 Mavis Dr
- 3231 Vineyard Ave Unit 141
- 3231 Vineyard Ave Unit 33
- 3231 Vineyard Ave Unit 93
- 3263 Vineyard Ave Unit 113
- 3263 Vineyard Ave Unit 44
- 3263 Vineyard Ave Unit 68
- 3263 Vineyard Ave Unit 35
- 3263 Vineyard Ave Unit 62
- 3263 Vineyard Ave Unit 132
- 3263 Vineyard Ave Unit 89
- 3845 Vineyard Ave Unit F
- 351 Christina Ct
- 916 Concord St
- 948 Concord St
- 924 Riesling Dr
- 3650 Sirah Ct
- 880 Concord St
- 923 Concord St
- 945 Concord St
- 932 Riesling Dr
- 962 Concord St
- 3724 Pinot Ct
- 945 Riesling Dr
- 885 Concord St
- 3725 Riesling Ct
- 3710 Riesling Ct
- 3641 Sirah Ct
- 974 Concord St
- 940 Riesling Dr
- 850 Concord St
- 873 Concord St
- 3742 Pinot Ct
Your Personal Tour Guide
Ask me questions while you tour the home.