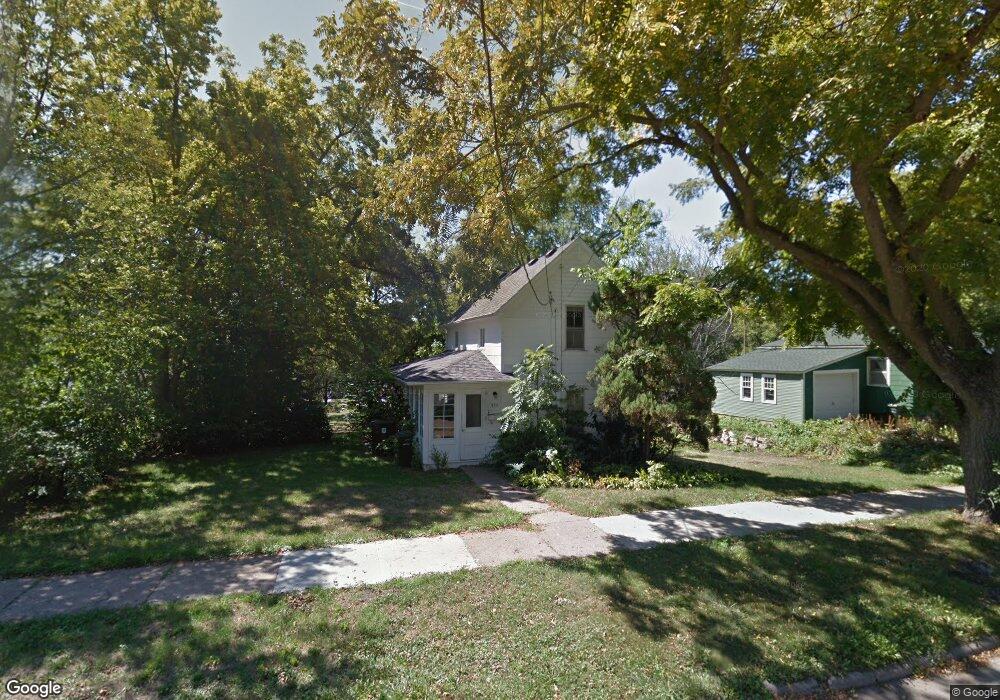
932 W 12th St Cedar Falls, IA 50613
Estimated Value: $50,000 - $185,000
2
Beds
1
Bath
710
Sq Ft
$135/Sq Ft
Est. Value
About This Home
This home is located at 932 W 12th St, Cedar Falls, IA 50613 and is currently estimated at $95,667, approximately $134 per square foot. 932 W 12th St is a home located in Black Hawk County with nearby schools including Lincoln Elementary School, Holmes Junior High School, and Cedar Falls High School.
Ownership History
Date
Name
Owned For
Owner Type
Purchase Details
Closed on
Aug 20, 2024
Sold by
Rentcf Llc
Bought by
Carolan Blake
Current Estimated Value
Home Financials for this Owner
Home Financials are based on the most recent Mortgage that was taken out on this home.
Original Mortgage
$85,000
Interest Rate
7.02%
Mortgage Type
Credit Line Revolving
Purchase Details
Closed on
Jun 28, 2024
Sold by
Nelson Bonnie Sue and Nelson Daniel
Bought by
Rentcf Llc
Home Financials for this Owner
Home Financials are based on the most recent Mortgage that was taken out on this home.
Original Mortgage
$85,000
Interest Rate
7.02%
Mortgage Type
Credit Line Revolving
Purchase Details
Closed on
Apr 11, 2022
Sold by
Bunger Carrie T
Bought by
Nelson Bonnie Sue
Create a Home Valuation Report for This Property
The Home Valuation Report is an in-depth analysis detailing your home's value as well as a comparison with similar homes in the area
Home Values in the Area
Average Home Value in this Area
Purchase History
| Date | Buyer | Sale Price | Title Company |
|---|---|---|---|
| Carolan Blake | $61,500 | None Listed On Document | |
| Rentcf Llc | $45,000 | None Listed On Document | |
| Nelson Bonnie Sue | -- | Engelbrecht David M |
Source: Public Records
Mortgage History
| Date | Status | Borrower | Loan Amount |
|---|---|---|---|
| Previous Owner | Rentcf Llc | $85,000 |
Source: Public Records
Tax History
| Year | Tax Paid | Tax Assessment Tax Assessment Total Assessment is a certain percentage of the fair market value that is determined by local assessors to be the total taxable value of land and additions on the property. | Land | Improvement |
|---|---|---|---|---|
| 2025 | $1,512 | $52,790 | $52,790 | $0 |
| 2024 | $1,456 | $93,130 | $34,840 | $58,290 |
| 2023 | $1,466 | $93,130 | $34,840 | $58,290 |
| 2022 | $1,484 | $79,440 | $34,840 | $44,600 |
| 2021 | $1,360 | $79,440 | $34,840 | $44,600 |
| 2020 | $1,332 | $73,010 | $25,160 | $47,850 |
| 2019 | $1,332 | $73,010 | $25,160 | $47,850 |
| 2018 | $1,326 | $71,790 | $25,160 | $46,630 |
| 2017 | $1,326 | $71,790 | $25,160 | $46,630 |
| 2016 | $1,126 | $63,680 | $25,160 | $38,520 |
| 2015 | $1,126 | $63,680 | $25,160 | $38,520 |
| 2014 | $1,138 | $63,680 | $25,160 | $38,520 |
Source: Public Records
Map
Nearby Homes
- 927 W 14th St
- 801 W 14th St
- 706 W 12th St
- 821 College St
- 904 Columbia Dr
- 721 Olive St
- 406 W 12th St
- 1321 Franklin St
- 1207 Clay St
- 623 W 6th St
- 603 Iowa St
- 1804 Tremont St
- 1622 Franklin St
- 1816 Tremont St
- 1033 Barrington Dr
- 832 Clay St
- 808 Clay St
- 2007 College St
- 1809 W 18th St Unit B
- 1916 Shelden Ave
Your Personal Tour Guide
Ask me questions while you tour the home.