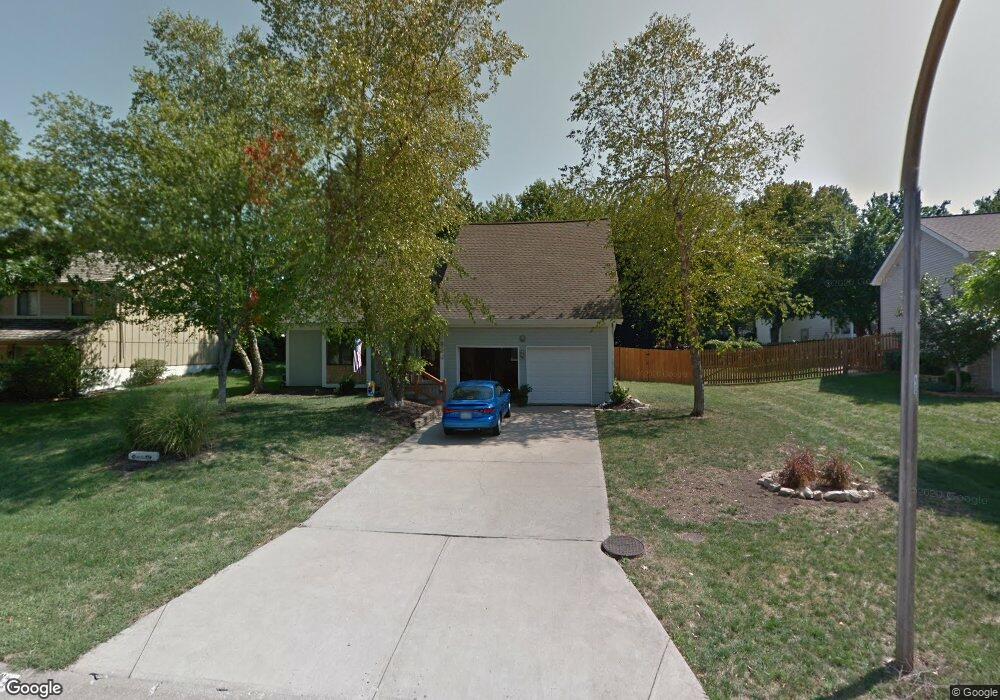
9323 Acuff Ln Lenexa, KS 66215
Estimated Value: $347,000 - $376,000
3
Beds
3
Baths
1,427
Sq Ft
$253/Sq Ft
Est. Value
About This Home
This home is located at 9323 Acuff Ln, Lenexa, KS 66215 and is currently estimated at $361,574, approximately $253 per square foot. 9323 Acuff Ln is a home located in Johnson County with nearby schools including Sunflower Elementary School, Westridge Middle School, and Shawnee Mission West High School.
Ownership History
Date
Name
Owned For
Owner Type
Purchase Details
Closed on
Jun 28, 2006
Sold by
Kretzmeier Gregory L and Kretzmeier Linda B
Bought by
Minter John Mark and Minter Terri L
Current Estimated Value
Home Financials for this Owner
Home Financials are based on the most recent Mortgage that was taken out on this home.
Original Mortgage
$174,650
Outstanding Balance
$103,800
Interest Rate
6.67%
Mortgage Type
VA
Estimated Equity
$257,774
Create a Home Valuation Report for This Property
The Home Valuation Report is an in-depth analysis detailing your home's value as well as a comparison with similar homes in the area
Home Values in the Area
Average Home Value in this Area
Purchase History
| Date | Buyer | Sale Price | Title Company |
|---|---|---|---|
| Minter John Mark | -- | Multiple |
Source: Public Records
Mortgage History
| Date | Status | Borrower | Loan Amount |
|---|---|---|---|
| Open | Minter John Mark | $174,650 |
Source: Public Records
Tax History Compared to Growth
Tax History
| Year | Tax Paid | Tax Assessment Tax Assessment Total Assessment is a certain percentage of the fair market value that is determined by local assessors to be the total taxable value of land and additions on the property. | Land | Improvement |
|---|---|---|---|---|
| 2024 | $4,228 | $38,306 | $6,724 | $31,582 |
| 2023 | $4,041 | $35,880 | $6,724 | $29,156 |
| 2022 | $3,609 | $32,005 | $5,848 | $26,157 |
| 2021 | $3,491 | $29,313 | $5,567 | $23,746 |
| 2020 | $3,342 | $27,772 | $5,567 | $22,205 |
| 2019 | $3,074 | $25,496 | $4,638 | $20,858 |
| 2018 | $2,988 | $24,553 | $4,638 | $19,915 |
| 2017 | $2,869 | $22,839 | $4,033 | $18,806 |
| 2016 | $2,710 | $21,286 | $4,033 | $17,253 |
| 2015 | $2,676 | $21,171 | $4,033 | $17,138 |
| 2013 | -- | $19,193 | $4,033 | $15,160 |
Source: Public Records
Map
Nearby Homes
- 9318 Greenway Ln
- 9202 Greenway Ln
- 9029 Acuff Ln
- 9131 Darnell St
- 9124 Constance St
- 8919 Greenway Ln
- 14101 W 88th Place
- 8946 Country Hill Ct
- 15320 W 92nd Place
- 8861 Carriage Dr
- 13312 W 91st St
- 8641 Greenwood Ln
- 13017 W 92nd St
- 9207 Boehm Dr
- 9203 Boehm Dr
- 12894 W 93rd St
- 15920 W 91st Terrace
- 14424 W 84th Terrace
- 8616 Baska Ct
- 10184 Haskins St
- 9319 Acuff Ln
- 9327 Acuff Ln
- 9340 Mullen Rd
- 9334 Mullen Rd
- 9315 Acuff Ln
- 9333 Acuff Ln
- 9348 Mullen Rd
- 9326 Acuff Ln
- 14404 W 93rd Terrace
- 9328 Mullen Rd
- 9311 Acuff Ln
- 9400 Mullen Rd
- 9322 Mullen Rd
- 9334 Acuff Ln
- 14410 W 93rd Terrace
- 9335 Acuff Ln
- 9312 Acuff Ln
- 14409 W 93rd Terrace
- 9307 Acuff Ln
- 9335 Mullen Rd