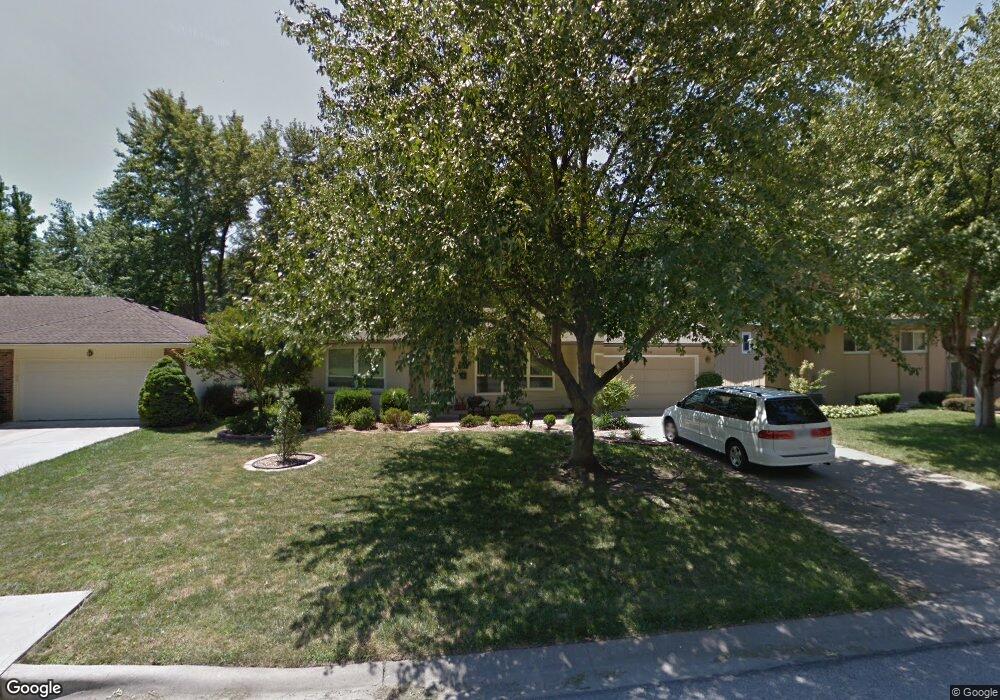
9324 Kessler Ln Overland Park, KS 66212
Elmhurst NeighborhoodEstimated Value: $363,000 - $384,000
3
Beds
3
Baths
1,370
Sq Ft
$270/Sq Ft
Est. Value
About This Home
This home is located at 9324 Kessler Ln, Overland Park, KS 66212 and is currently estimated at $370,303, approximately $270 per square foot. 9324 Kessler Ln is a home located in Johnson County with nearby schools including Pawnee Elementary School, Westridge Middle School, and Shawnee Mission West High School.
Ownership History
Date
Name
Owned For
Owner Type
Purchase Details
Closed on
Dec 21, 2023
Sold by
Nanney Tommy Gerard and Nanney Sherry E
Bought by
Nanney Tommy Gerard and Nanney Sherry E
Current Estimated Value
Purchase Details
Closed on
Jun 3, 2005
Sold by
Kirk Matthew A and Kirk Kira
Bought by
Nanney Tom G and Nanney Sherry E
Home Financials for this Owner
Home Financials are based on the most recent Mortgage that was taken out on this home.
Original Mortgage
$27,525
Interest Rate
5.78%
Mortgage Type
Stand Alone Second
Purchase Details
Closed on
Sep 20, 2004
Sold by
Vanhoecke Christopher J and Vanhoecke Theresa L
Bought by
Kirk Kira M
Purchase Details
Closed on
Sep 19, 2001
Sold by
Lipp Richard W and Lipp Linda S
Bought by
Kirk Matthew A
Home Financials for this Owner
Home Financials are based on the most recent Mortgage that was taken out on this home.
Original Mortgage
$139,978
Interest Rate
6.96%
Mortgage Type
FHA
Create a Home Valuation Report for This Property
The Home Valuation Report is an in-depth analysis detailing your home's value as well as a comparison with similar homes in the area
Home Values in the Area
Average Home Value in this Area
Purchase History
| Date | Buyer | Sale Price | Title Company |
|---|---|---|---|
| Nanney Tommy Gerard | -- | None Listed On Document | |
| Nanney Tom G | -- | None Available | |
| Kirk Kira M | -- | -- | |
| Kirk Matthew A | -- | Security Land Title Company |
Source: Public Records
Mortgage History
| Date | Status | Borrower | Loan Amount |
|---|---|---|---|
| Previous Owner | Nanney Tom G | $27,525 | |
| Previous Owner | Nanney Tom G | $146,800 | |
| Previous Owner | Kirk Matthew A | $139,978 |
Source: Public Records
Tax History Compared to Growth
Tax History
| Year | Tax Paid | Tax Assessment Tax Assessment Total Assessment is a certain percentage of the fair market value that is determined by local assessors to be the total taxable value of land and additions on the property. | Land | Improvement |
|---|---|---|---|---|
| 2024 | $3,917 | $40,641 | $7,749 | $32,892 |
| 2023 | $3,681 | $37,640 | $7,749 | $29,891 |
| 2022 | $3,299 | $33,994 | $7,749 | $26,245 |
| 2021 | $3,162 | $30,969 | $6,458 | $24,511 |
| 2020 | $2,941 | $28,842 | $4,970 | $23,872 |
| 2019 | $2,756 | $27,059 | $3,996 | $23,063 |
| 2018 | $2,637 | $25,783 | $3,996 | $21,787 |
| 2017 | $2,413 | $23,230 | $3,996 | $19,234 |
| 2016 | $2,273 | $21,528 | $3,996 | $17,532 |
| 2015 | $2,150 | $20,792 | $3,996 | $16,796 |
| 2013 | -- | $19,895 | $3,996 | $15,899 |
Source: Public Records
Map
Nearby Homes
- 9406 Kessler Ln
- 9303 Grant Dr
- 9303 Hayes Dr
- 9193 W 92nd Place
- 9503 Grandview St
- 9146 W 92nd Place
- 9531 Kessler St
- 9135 Hayes Dr
- 9605 Eby St
- 9121 Hayes Dr
- 9028 Grant St
- 9020 Grandview Dr
- 9210 Farley Ln
- 9415 Moody Park Dr
- 9310 W 90th St
- 8926 Grant St
- 9708 W 96th Terrace
- 9801 Grandview St
- 8947 Knox Ln
- 8931 Knox Ln
- 9328 Kessler Ln
- 9320 Kessler Ln
- 9332 Kessler Ln
- 9316 Kessler Ln
- 9335 Hayes Dr
- 9102 W 93rd Terrace
- 9312 Kessler Ln
- 9336 Kessler Ln
- 9305 Kessler Ln
- 9401 Hayes Dr
- 9403 Hayes Dr
- 9331 Hayes Dr
- 9311 Kessler Ln
- 9109 W 93rd St
- 9308 Kessler Ln
- 9400 Kessler Ln
- 9407 Hayes Dr
- 9315 Kessler Ln
- 9014 W 93rd Terrace
- 9105 W 93rd St