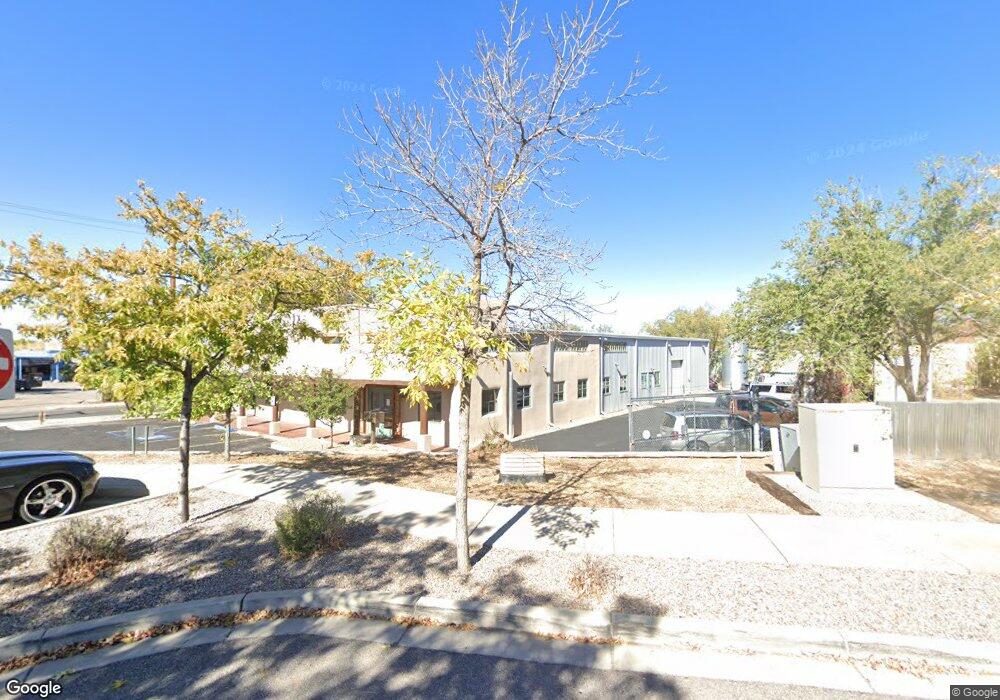
933 Baca St Unit A Santa Fe, NM 87505
--
Bed
--
Bath
8,000
Sq Ft
0.53
Acres
About This Home
This home is located at 933 Baca St Unit A, Santa Fe, NM 87505. 933 Baca St Unit A is a home located in Santa Fe County with nearby schools including Aspen Community Magnet School, Capital High School, and Ms. Cohen's Homeschool Classroom.
Ownership History
Date
Name
Owned For
Owner Type
Purchase Details
Closed on
Jul 30, 2024
Sold by
Greiner William and Dyess Jennifer
Bought by
Dgbaca Llc
Purchase Details
Closed on
Jun 5, 2017
Sold by
Blakeney Velma Sherrod
Bought by
Creekwood Real Estate Llc
Purchase Details
Closed on
Mar 10, 2017
Sold by
933 Baca Llc
Bought by
Blakeney Velma Sherrod
Purchase Details
Closed on
Jul 10, 2006
Sold by
Paisley Linda L and Wiman Stephen K
Bought by
933 Baca Llc
Purchase Details
Closed on
May 23, 2006
Sold by
Sand Castle Inc
Bought by
Paisley Linda L and Wiman Stephen K
Purchase Details
Closed on
Aug 29, 2002
Sold by
Weishaupt Joseph M and Weishaupt Louise
Bought by
Sand Castle Inc
Home Financials for this Owner
Home Financials are based on the most recent Mortgage that was taken out on this home.
Original Mortgage
$464,000
Interest Rate
8%
Mortgage Type
Seller Take Back
Create a Home Valuation Report for This Property
The Home Valuation Report is an in-depth analysis detailing your home's value as well as a comparison with similar homes in the area
Home Values in the Area
Average Home Value in this Area
Purchase History
| Date | Buyer | Sale Price | Title Company |
|---|---|---|---|
| Dgbaca Llc | -- | Artisan Title | |
| Creekwood Real Estate Llc | -- | None Available | |
| Blakeney Velma Sherrod | -- | None Available | |
| 933 Baca Llc | -- | None Available | |
| Paisley Linda L | -- | Quiet Title Co Llc | |
| Sand Castle Inc | -- | Multiple | |
| Sand Castle Inc | $580,000 | -- |
Source: Public Records
Mortgage History
| Date | Status | Borrower | Loan Amount |
|---|---|---|---|
| Previous Owner | Sand Castle Inc | $464,000 |
Source: Public Records
Tax History Compared to Growth
Tax History
| Year | Tax Paid | Tax Assessment Tax Assessment Total Assessment is a certain percentage of the fair market value that is determined by local assessors to be the total taxable value of land and additions on the property. | Land | Improvement |
|---|---|---|---|---|
| 2024 | $8,321 | $775,063 | $180,480 | $594,583 |
| 2023 | $7,974 | $743,933 | $180,480 | $563,453 |
| 2022 | $6,692 | $614,434 | $180,480 | $433,954 |
| 2021 | $6,368 | $193,693 | $60,159 | $133,534 |
| 2020 | $8,550 | $261,796 | $60,159 | $201,637 |
| 2019 | $8,388 | $255,769 | $60,159 | $195,610 |
| 2018 | $7,458 | $226,681 | $60,159 | $166,522 |
| 2017 | $7,480 | $225,865 | $60,159 | $165,706 |
| 2016 | $7,266 | $225,553 | $60,160 | $165,393 |
| 2015 | $7,208 | $227,130 | $60,160 | $166,970 |
| 2014 | $4,727 | $150,182 | $90,150 | $60,032 |
Source: Public Records
Map
Nearby Homes
- 1333 Pacheco St
- 1455 Laguna St
- 1347 Pacheco Ct Unit 3
- 1428 1/2 Hickox St
- 630 Alicia St
- 1530 Hickox St
- 1536 1/2 Hickox St
- 717 Kathryn Ave
- 149 Prudencio St
- 151 Prudencio St
- 0 Aqua Fria Unit 202504577
- 1433 Cochiti St
- 1217 Agua Fria St
- Salinas Plan at Dos Acequias
- Chaco Plan at Dos Acequias
- Mijas Plan at Dos Acequias
- Bosque Plan at Dos Acequias
- 1513 Cochiti St
- 232 Delfina St
- 222 Delfina St
- 933 Baca St
- 931 Shoofly St
- 925 Baca St Unit A/B
- 925 Baca St
- 1225 Flagman Way Unit A/B
- 931 Shoofly St Unit A
- 931 Shoofly St Unit 3
- 931 Shoofly St Unit N
- 931 Shoofly St Unit M
- 931 Shoofly St
- 922 Baca St
- 920 Baca St
- 914 Baca St
- 1222 Flagman Way
- 825 Baca St
- 1221 Flagman Way Unit B1-B4
- 1221 Flagman Way
- 1221 Flagman Way Unit A - B
- 1221 Flagman Way Unit B-7
- 1221 Flagman Way Unit B-6