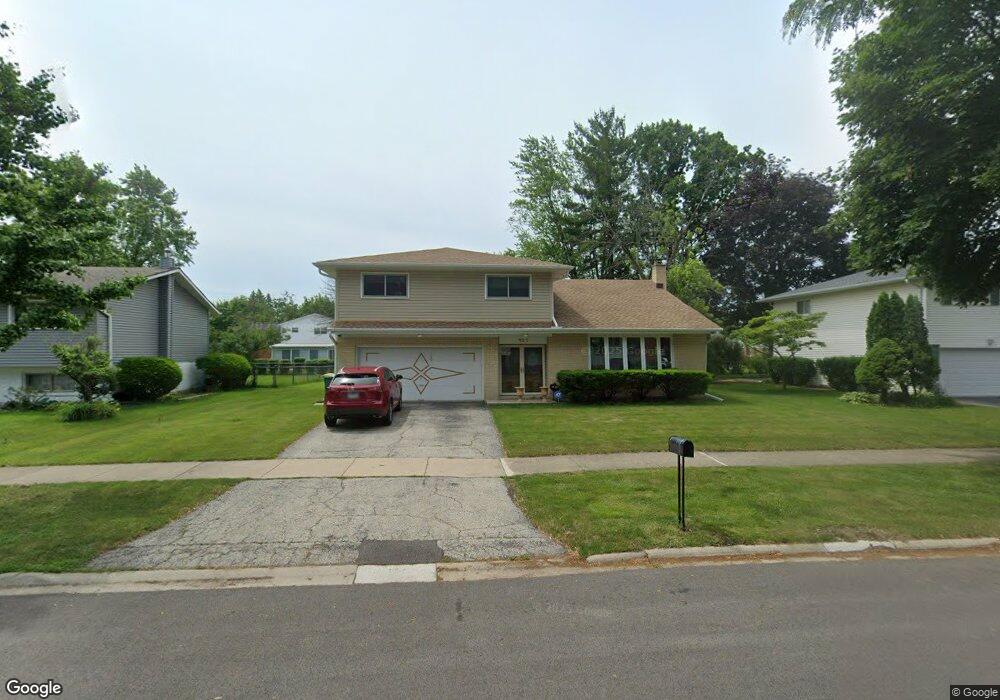
933 Rose Ln Wheeling, IL 60090
Estimated Value: $492,000 - $687,000
4
Beds
3
Baths
3,195
Sq Ft
$191/Sq Ft
Est. Value
About This Home
This home is located at 933 Rose Ln, Wheeling, IL 60090 and is currently estimated at $608,708, approximately $190 per square foot. 933 Rose Ln is a home located in Cook County with nearby schools including Dwight D Eisenhower Elementary School, Anne Sullivan Elementary School, and Betsy Ross Elementary School.
Ownership History
Date
Name
Owned For
Owner Type
Purchase Details
Closed on
Jun 29, 2017
Sold by
Yang Tao
Bought by
Yang Tao and Lin Feng E
Current Estimated Value
Home Financials for this Owner
Home Financials are based on the most recent Mortgage that was taken out on this home.
Original Mortgage
$210,000
Outstanding Balance
$174,378
Interest Rate
3.87%
Mortgage Type
New Conventional
Estimated Equity
$434,330
Purchase Details
Closed on
May 4, 2004
Sold by
Jung Byung Kwan and Cho Mi Ok
Bought by
Yang Tao
Home Financials for this Owner
Home Financials are based on the most recent Mortgage that was taken out on this home.
Original Mortgage
$297,500
Interest Rate
5.91%
Mortgage Type
Unknown
Purchase Details
Closed on
Jul 15, 1999
Sold by
Hitzeman Thomas E and Hitzeman Patricia E
Bought by
Jung Byung Kwan and Cho Mi Ok
Home Financials for this Owner
Home Financials are based on the most recent Mortgage that was taken out on this home.
Original Mortgage
$216,000
Interest Rate
7.43%
Mortgage Type
Stand Alone First
Create a Home Valuation Report for This Property
The Home Valuation Report is an in-depth analysis detailing your home's value as well as a comparison with similar homes in the area
Home Values in the Area
Average Home Value in this Area
Purchase History
| Date | Buyer | Sale Price | Title Company |
|---|---|---|---|
| Yang Tao | -- | Lakeland Title Services | |
| Yang Tao | $372,000 | First American Title Ins Co | |
| Jung Byung Kwan | $270,000 | 1St American Title |
Source: Public Records
Mortgage History
| Date | Status | Borrower | Loan Amount |
|---|---|---|---|
| Open | Yang Tao | $210,000 | |
| Closed | Yang Tao | $297,500 | |
| Previous Owner | Jung Byung Kwan | $216,000 |
Source: Public Records
Tax History Compared to Growth
Tax History
| Year | Tax Paid | Tax Assessment Tax Assessment Total Assessment is a certain percentage of the fair market value that is determined by local assessors to be the total taxable value of land and additions on the property. | Land | Improvement |
|---|---|---|---|---|
| 2024 | $12,050 | $43,845 | $11,000 | $32,845 |
| 2023 | $11,481 | $43,845 | $11,000 | $32,845 |
| 2022 | $11,481 | $43,845 | $11,000 | $32,845 |
| 2021 | $10,168 | $34,035 | $7,500 | $26,535 |
| 2020 | $9,967 | $34,035 | $7,500 | $26,535 |
| 2019 | $10,013 | $37,986 | $7,500 | $30,486 |
| 2018 | $10,394 | $36,091 | $6,500 | $29,591 |
| 2017 | $10,265 | $36,091 | $6,500 | $29,591 |
| 2016 | $9,802 | $36,091 | $6,500 | $29,591 |
| 2015 | $9,754 | $33,442 | $5,750 | $27,692 |
| 2014 | $9,519 | $33,442 | $5,750 | $27,692 |
| 2013 | $9,221 | $33,442 | $5,750 | $27,692 |
Source: Public Records
Map
Nearby Homes
- 10 N Wildwood Dr
- 1014 N Elmhurst Rd
- 21 E Stonegate Dr
- 940 Tanglewood Dr
- 701 Garth Rd
- 1201 Pleasant Run Dr Unit 312
- 1094 Shady Tree Ln
- 1088 Pear Tree Ln
- 412 Cherry Creek Ln
- 1088 Captains Ln
- 963 S Fletcher Dr
- 2812 Jackson Dr
- 1044 Creekside Ct Unit 2B
- 2822 Jackson Dr
- 709 S Dennis Rd
- 1376 Longacre Ln Unit 113
- 1321 Longacre Ln Unit 45
- 200 Violet Ln
- 1430 Sandstone Dr Unit 202
- 791 Lakeside Circle Dr Unit 1
- 921 Rose Ln
- 941 Rose Ln Unit 1
- 936 Garden Ln
- 944 Garden Ln Unit 944
- 922 Garden Ln Unit 922
- 913 Rose Ln
- 932 Rose Ln
- 952 Garden Ln
- 912 Garden Ln Unit 912
- 940 Rose Ln
- 924 Rose Ln
- 905 Rose Ln
- 957 Rose Ln
- 952 Rose Ln
- 914 Rose Ln
- 962 Garden Ln
- 906 Garden Ln Unit 2
- 960 Rose Ln
- 902 Rose Ln
- 933 Garden Ln Unit 2