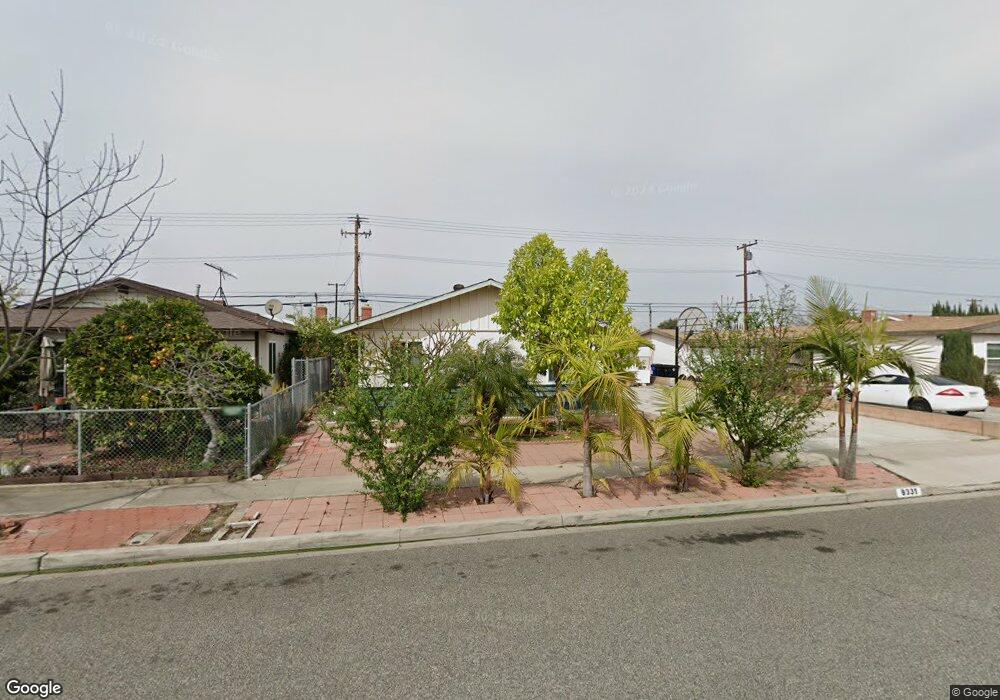
9331 Pyle Cir Westminster, CA 92683
Little Saigon NeighborhoodEstimated Value: $910,000 - $1,018,440
4
Beds
2
Baths
1,434
Sq Ft
$671/Sq Ft
Est. Value
About This Home
This home is located at 9331 Pyle Cir, Westminster, CA 92683 and is currently estimated at $962,110, approximately $670 per square foot. 9331 Pyle Cir is a home located in Orange County with nearby schools including John Murdy Elementary School, McGarvin Intermediate School, and La Quinta High School.
Ownership History
Date
Name
Owned For
Owner Type
Purchase Details
Closed on
Dec 13, 2021
Sold by
Vu John and Vu Ha Ho
Bought by
Nguyen Peter An Thien
Current Estimated Value
Purchase Details
Closed on
Oct 14, 2015
Sold by
Vu Dai Trang and Vu Thuy Ngoc
Bought by
Vu John and Vu Ha Ho
Purchase Details
Closed on
Oct 7, 2014
Sold by
Vu Julie and Vu Henry
Bought by
Vu Dai Trang and Vu Thuy Ngoc
Purchase Details
Closed on
May 8, 2013
Sold by
Tu Angelique Kim
Bought by
Vu Henry
Purchase Details
Closed on
May 6, 2013
Sold by
Vu Anh Kim and Vu Julie
Bought by
Vu Julie and Vu Henry
Purchase Details
Closed on
Dec 7, 1995
Sold by
Vu Huy Ngoc
Bought by
Vu Anh Kim and Vu Julie
Purchase Details
Closed on
Mar 4, 1995
Sold by
Vu Huyen Ngoc and Vu Huy Ngoc
Bought by
Vu Huy Ngoc and Vu Anh Kim
Purchase Details
Closed on
Feb 9, 1995
Sold by
Vu Huyen Ngoc
Bought by
Vu Huyen Ngoc and Vu Huy Ngoc
Create a Home Valuation Report for This Property
The Home Valuation Report is an in-depth analysis detailing your home's value as well as a comparison with similar homes in the area
Home Values in the Area
Average Home Value in this Area
Purchase History
| Date | Buyer | Sale Price | Title Company |
|---|---|---|---|
| Nguyen Peter An Thien | -- | None Available | |
| Vu John | -- | None Available | |
| Vu Dai Trang | -- | None Available | |
| Vu Henry | -- | None Available | |
| Vu Julie | -- | None Available | |
| Vu Anh Kim | -- | -- | |
| Vu Huy Ngoc | -- | -- | |
| Vu Huyen Ngoc | -- | -- |
Source: Public Records
Tax History
| Year | Tax Paid | Tax Assessment Tax Assessment Total Assessment is a certain percentage of the fair market value that is determined by local assessors to be the total taxable value of land and additions on the property. | Land | Improvement |
|---|---|---|---|---|
| 2025 | $8,207 | $705,703 | $614,529 | $91,174 |
| 2024 | $8,207 | $691,866 | $602,479 | $89,387 |
| 2023 | $8,054 | $678,300 | $590,665 | $87,635 |
| 2022 | $7,878 | $665,000 | $579,083 | $85,917 |
| 2021 | $6,326 | $514,012 | $426,939 | $87,073 |
| 2020 | $6,244 | $508,742 | $422,561 | $86,181 |
| 2019 | $6,128 | $498,767 | $414,275 | $84,492 |
| 2018 | $6,010 | $488,988 | $406,152 | $82,836 |
| 2017 | $5,933 | $479,400 | $398,188 | $81,212 |
| 2016 | $5,684 | $470,000 | $390,380 | $79,620 |
| 2015 | $5,685 | $470,000 | $390,380 | $79,620 |
| 2014 | $3,842 | $308,791 | $228,826 | $79,965 |
Source: Public Records
Map
Nearby Homes
- 14362 Bushard St Unit 17
- 19 Sorbonne St
- 9619 Hazard Ave
- 9633 Hazard Ave
- 14172 Swan St
- 14571 Wakefield St
- 14642 Birch St
- 9121 Reading Ave
- 9031 Washington Ave
- 8866 Grandville Cir
- 9200 Westminster Blvd Unit 71
- 14799 Apricot Ln
- 15065 Henley Dr Unit 1
- 15110 Henley Dr Unit 51
- 13950 Magnolia St
- 9906 13th St
- 9702 Bolsa Ave Unit 30
- 14068 Tiffany Dr
- 14331 Riata St
- 8784 Hewitt Place Unit 12
- 9321 Pyle Cir
- 9341 Pyle Cir
- 9311 Pyle Cir
- 9361 Pyle Cir
- 9330 Pyle Cir
- 9320 Pyle Cir
- 9340 Pyle Cir
- 9301 Pyle Cir
- 9311 Hazard Ave
- 9310 Pyle Cir
- 9312 Kern Ave
- 9291 Hazard Ave Unit AANDB
- 9291 Hazard Ave Unit AB
- 9291 Hazard Ave
- 9360 Pyle Cir
- 9371 Pyle Cir
- 9281 Hazard Ave
- 9300 Pyle Cir
- 9381 Pyle Cir
- 9331 Bird Ave
Your Personal Tour Guide
Ask me questions while you tour the home.