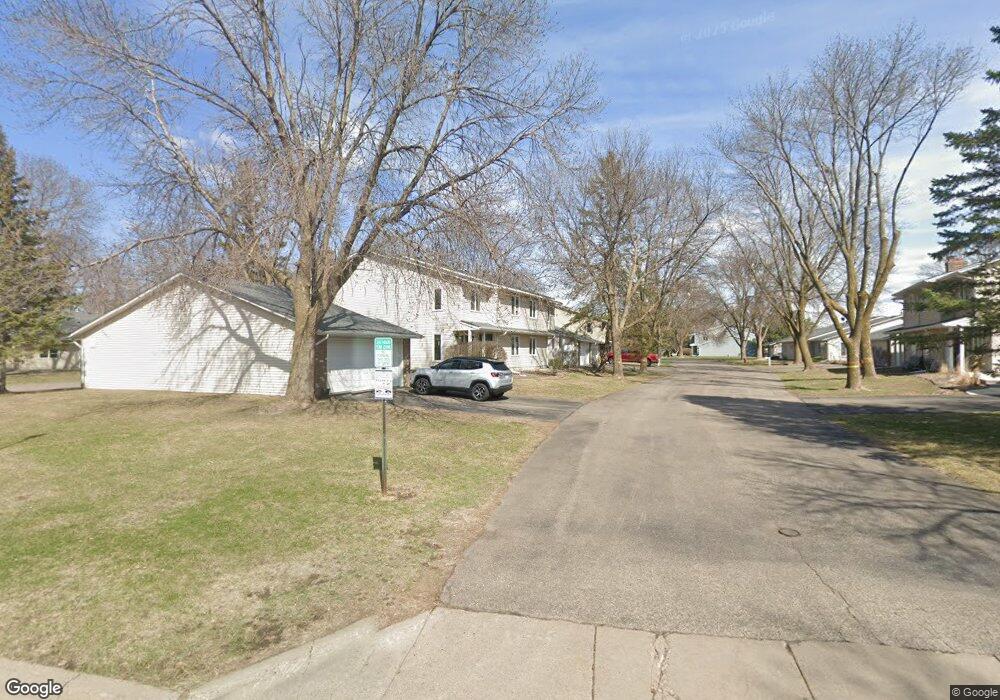
9332 Ranchview Ln N Maple Grove, MN 55369
Estimated Value: $234,796 - $265,000
2
Beds
2
Baths
1,136
Sq Ft
$216/Sq Ft
Est. Value
About This Home
This home is located at 9332 Ranchview Ln N, Maple Grove, MN 55369 and is currently estimated at $245,199, approximately $215 per square foot. 9332 Ranchview Ln N is a home located in Hennepin County with nearby schools including Fernbrook Elementary School, Osseo Middle School, and Maple Grove Senior High School.
Ownership History
Date
Name
Owned For
Owner Type
Purchase Details
Closed on
Sep 30, 2020
Sold by
Vraa Beth M
Bought by
Johnson Jodi M
Current Estimated Value
Home Financials for this Owner
Home Financials are based on the most recent Mortgage that was taken out on this home.
Original Mortgage
$183,350
Outstanding Balance
$162,783
Interest Rate
2.8%
Mortgage Type
New Conventional
Estimated Equity
$82,416
Purchase Details
Closed on
Dec 4, 2015
Sold by
Ortman Alexandra M
Bought by
Vraa Beth M
Home Financials for this Owner
Home Financials are based on the most recent Mortgage that was taken out on this home.
Original Mortgage
$134,518
Interest Rate
3.92%
Mortgage Type
New Conventional
Purchase Details
Closed on
Oct 29, 1999
Sold by
Tjepkes Kimberly Jo
Bought by
Cici Ingeborg M
Purchase Details
Closed on
Jan 29, 1997
Sold by
Deisting Mark A and Deisting Charlene M
Bought by
Tjepkes Kimberly Jo
Create a Home Valuation Report for This Property
The Home Valuation Report is an in-depth analysis detailing your home's value as well as a comparison with similar homes in the area
Home Values in the Area
Average Home Value in this Area
Purchase History
| Date | Buyer | Sale Price | Title Company |
|---|---|---|---|
| Johnson Jodi M | $193,000 | All American Title Co Inc | |
| Vraa Beth M | $137,000 | Burnet Title | |
| Cici Ingeborg M | $95,500 | -- | |
| Tjepkes Kimberly Jo | $77,000 | -- | |
| Johnson Jodi Jodi | $193,000 | -- |
Source: Public Records
Mortgage History
| Date | Status | Borrower | Loan Amount |
|---|---|---|---|
| Open | Johnson Jodi M | $183,350 | |
| Previous Owner | Vraa Beth M | $134,518 | |
| Closed | Johnson Jodi Jodi | $183,350 |
Source: Public Records
Tax History
| Year | Tax Paid | Tax Assessment Tax Assessment Total Assessment is a certain percentage of the fair market value that is determined by local assessors to be the total taxable value of land and additions on the property. | Land | Improvement |
|---|---|---|---|---|
| 2024 | $2,463 | $223,700 | $74,500 | $149,200 |
| 2023 | $2,284 | $209,200 | $58,600 | $150,600 |
| 2022 | $1,912 | $196,900 | $40,400 | $156,500 |
| 2021 | $1,769 | $175,200 | $42,400 | $132,800 |
| 2020 | $1,728 | $161,800 | $34,900 | $126,900 |
| 2019 | $1,635 | $151,900 | $33,700 | $118,200 |
| 2018 | $1,605 | $138,600 | $29,800 | $108,800 |
| 2017 | $1,510 | $124,300 | $32,000 | $92,300 |
| 2016 | $1,781 | $111,700 | $27,000 | $84,700 |
| 2015 | $1,460 | $109,800 | $27,000 | $82,800 |
| 2014 | -- | $97,700 | $28,000 | $69,700 |
Source: Public Records
Map
Nearby Homes
- 9246 Shenandoah Ln N
- 9482 Niagara Ln N
- 14714 Lanewood Ct
- 15637 91st Ave N
- 10625 Juneau Ln N
- 11010 Archer Ln N
- 9062 Archer Ln N
- 11050 Archer Ct N
- 8858 Comstock Ct
- 16863 90th Ct N
- 9275 Holly Ln N
- 8565 Upland Ln N
- 9037 Garland Ln N
- 10145 Peony Ln N
- 8940 Yucca Ln N
- 13952 Rice Lake Cir
- 13630 87th Ave N
- 14481 103rd Place N
- 14491 103rd Place N
- 9260 Merrimac Ln N
- 9342 Ranchview Ln N
- 9336 Ranchview Ln N
- 9330 Ranchview Ln N
- 9346 Ranchview Ln N
- 9322 Ranchview Ln N
- 9320 Ranchview Ln N
- 9338 Ranchview Ln N
- 9312 Ranchview Ln N
- 9352 Ranchview Ln N
- 9310 Ranchview Ln N
- 9356 Ranchview Ln N
- 9348 Ranchview Ln N
- 9316 Ranchview Ln N
- 9328 Ranchview Ln N
- 9358 Ranchview Ln N
- 9362 Ranchview Ln N
- 9366 Ranchview Ln N
- 9318 Ranchview Ln N
- 9360 Ranchview Ln N
- 9321 Ranchview Ln N
Your Personal Tour Guide
Ask me questions while you tour the home.