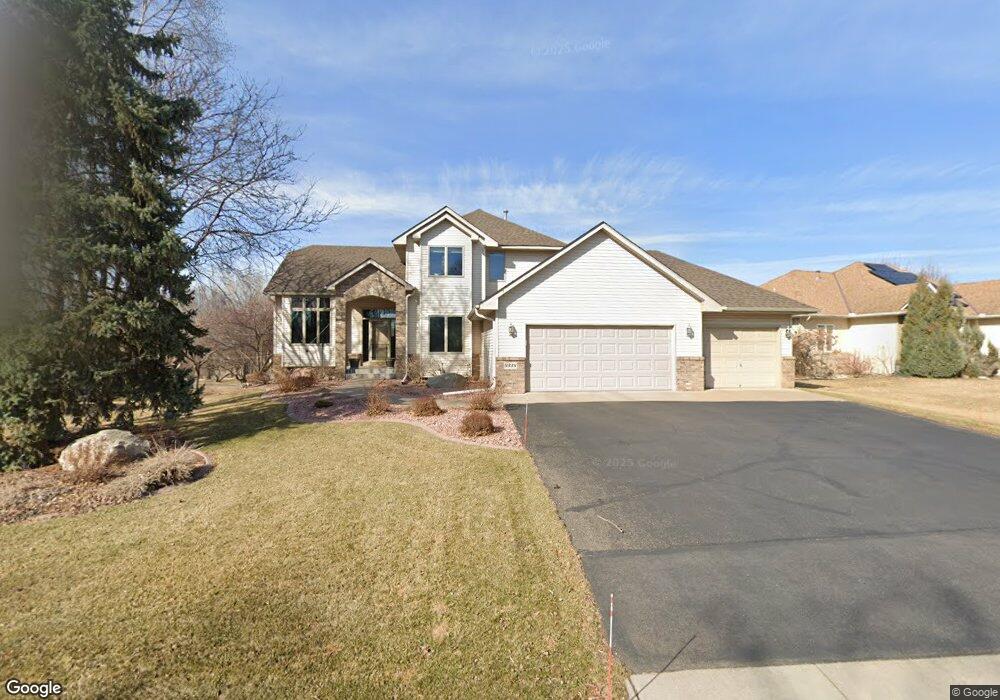
9338 Magnolia Way N Maple Grove, MN 55369
Estimated Value: $517,464 - $598,000
4
Beds
6
Baths
1,940
Sq Ft
$290/Sq Ft
Est. Value
About This Home
This home is located at 9338 Magnolia Way N, Maple Grove, MN 55369 and is currently estimated at $563,116, approximately $290 per square foot. 9338 Magnolia Way N is a home located in Hennepin County with nearby schools including Fernbrook Elementary School, Osseo Middle School, and Maple Grove Senior High School.
Ownership History
Date
Name
Owned For
Owner Type
Purchase Details
Closed on
Apr 21, 2023
Sold by
Schaefer Theresa M
Bought by
Schaefer Theresa M and Schaefer Susan M
Current Estimated Value
Purchase Details
Closed on
Jun 13, 2007
Sold by
Micheel Brad A and Micheel Natalie M
Bought by
Schaefer Theresa M
Purchase Details
Closed on
May 26, 2005
Sold by
Griswold David A and Griswold Amy M
Bought by
Micheel Brad A and Micheel Natalie M
Purchase Details
Closed on
Apr 21, 2000
Sold by
Cross Mark D and Cross Laura L
Bought by
Griswold David D and Griswold Amy M
Purchase Details
Closed on
May 27, 1998
Sold by
New Concepts In Custom Homes Inc
Bought by
Schenkelberg Laura L and Cross Mark D
Purchase Details
Closed on
Mar 3, 1998
Sold by
J-Iii Properties
Bought by
New Concepts In Custom Homes Inc
Create a Home Valuation Report for This Property
The Home Valuation Report is an in-depth analysis detailing your home's value as well as a comparison with similar homes in the area
Home Values in the Area
Average Home Value in this Area
Purchase History
| Date | Buyer | Sale Price | Title Company |
|---|---|---|---|
| Schaefer Theresa M | -- | None Listed On Document | |
| Schaefer Theresa M | $385,000 | -- | |
| Micheel Brad A | $400,000 | -- | |
| Griswold David D | $245,000 | -- | |
| Schenkelberg Laura L | $179,950 | -- | |
| New Concepts In Custom Homes Inc | $43,500 | -- |
Source: Public Records
Mortgage History
| Date | Status | Borrower | Loan Amount |
|---|---|---|---|
| Closed | New Concepts In Custom Homes Inc | -- |
Source: Public Records
Tax History Compared to Growth
Tax History
| Year | Tax Paid | Tax Assessment Tax Assessment Total Assessment is a certain percentage of the fair market value that is determined by local assessors to be the total taxable value of land and additions on the property. | Land | Improvement |
|---|---|---|---|---|
| 2024 | $6,041 | $498,100 | $105,700 | $392,400 |
| 2023 | $5,657 | $482,300 | $83,700 | $398,600 |
| 2022 | $5,048 | $484,400 | $75,200 | $409,200 |
| 2021 | $4,735 | $415,900 | $67,000 | $348,900 |
| 2020 | $4,657 | $385,700 | $65,300 | $320,400 |
| 2019 | $4,519 | $362,100 | $67,700 | $294,400 |
| 2018 | $4,727 | $333,900 | $50,000 | $283,900 |
| 2017 | $5,066 | $350,500 | $73,000 | $277,500 |
| 2016 | $4,860 | $333,100 | $60,000 | $273,100 |
| 2015 | $4,642 | $311,400 | $77,000 | $234,400 |
| 2014 | -- | $280,900 | $69,000 | $211,900 |
Source: Public Records
Map
Nearby Homes
- 9323 Kirkwood Ln N
- 9311 Kirkwood Ln N
- 9323 Magnolia Ln N
- 9132 Kirkwood Ln N
- 9146 Ives Ln N
- 12599 91st Place N
- 9201 Forestview Ln N
- 12795 95th Ave N
- 9058 Goldenrod Ln N
- 8949 Rosewood Ln N
- 11760 88th Place N
- 9061 Underwood Ln N
- 6866 Zachary Ln N
- 12509 88th Ave N
- 9880 Cottonwood Ln N
- 8864 Cottonwood Ln N
- 12769 88th Ave N
- 8735 Rosewood Ln N
- 13744 94th Ave N
- 8764 Cottonwood Ln N
- 9343 Kirkwood Way N
- 9350 Magnolia Way N
- 12233 94th Ave N
- 9355 Kirkwood Way N
- 12211 94th Ave N
- 9362 Magnolia Way N
- 12240 94th Ave N
- 9360 Magnolia Ln N
- 9333 Kirkwood Ln N
- 9367 Kirkwood Way N
- 9374 Magnolia Way N
- 12189 94th Ave N
- 9359 Magnolia Ln N
- 9348 Magnolia Ln N
- 9379 Kirkwood Way N
- 9386 Magnolia Way N
- 9336 Kirkwood Ln N
- 12228 94th Ave N
- 9347 Magnolia Ln N
- 12147 94th Ave N