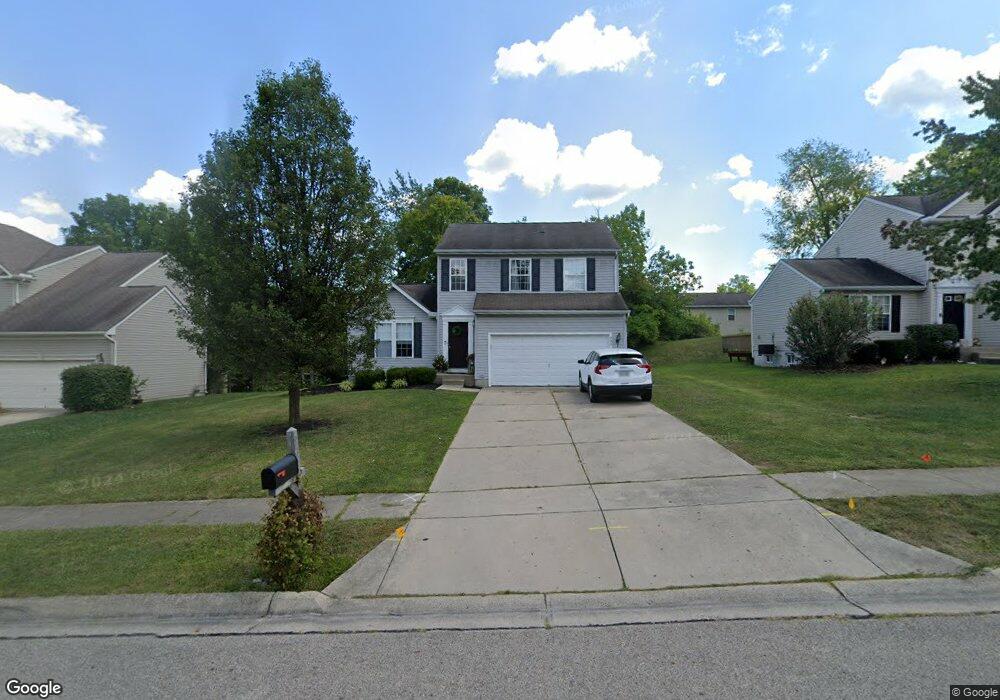
934 Whispering Pine Way Lebanon, OH 45036
Estimated Value: $329,748 - $362,000
3
Beds
3
Baths
1,422
Sq Ft
$240/Sq Ft
Est. Value
About This Home
This home is located at 934 Whispering Pine Way, Lebanon, OH 45036 and is currently estimated at $341,687, approximately $240 per square foot. 934 Whispering Pine Way is a home located in Warren County with nearby schools including Bowman Primary School, Donovan Elementary School, and Berry Intermediate School.
Ownership History
Date
Name
Owned For
Owner Type
Purchase Details
Closed on
Jan 4, 2024
Sold by
Peters Gerald A
Bought by
Peters Julie Jean
Current Estimated Value
Purchase Details
Closed on
Jul 25, 2023
Sold by
Peters Jeffrey G
Bought by
Peters Julie Jean
Purchase Details
Closed on
May 7, 2002
Sold by
Nvr Inc
Bought by
Peters Jeffrey G and Peters Gerald A
Home Financials for this Owner
Home Financials are based on the most recent Mortgage that was taken out on this home.
Original Mortgage
$148,401
Interest Rate
7.18%
Mortgage Type
FHA
Purchase Details
Closed on
Feb 27, 2002
Sold by
Robert C Rhein Int Inc
Bought by
Nvr Inc
Create a Home Valuation Report for This Property
The Home Valuation Report is an in-depth analysis detailing your home's value as well as a comparison with similar homes in the area
Home Values in the Area
Average Home Value in this Area
Purchase History
| Date | Buyer | Sale Price | Title Company |
|---|---|---|---|
| Peters Julie Jean | -- | None Listed On Document | |
| Peters Julie Jean | -- | None Listed On Document | |
| Peters Jeffrey G | $150,730 | -- | |
| Nvr Inc | $28,665 | -- |
Source: Public Records
Mortgage History
| Date | Status | Borrower | Loan Amount |
|---|---|---|---|
| Previous Owner | Peters Jeffrey G | $148,401 |
Source: Public Records
Tax History Compared to Growth
Tax History
| Year | Tax Paid | Tax Assessment Tax Assessment Total Assessment is a certain percentage of the fair market value that is determined by local assessors to be the total taxable value of land and additions on the property. | Land | Improvement |
|---|---|---|---|---|
| 2024 | $3,555 | $85,610 | $28,000 | $57,610 |
| 2023 | $2,951 | $63,850 | $12,915 | $50,935 |
| 2022 | $3,076 | $63,851 | $12,915 | $50,936 |
| 2021 | $2,907 | $63,851 | $12,915 | $50,936 |
| 2020 | $2,798 | $51,912 | $10,500 | $41,412 |
| 2019 | $2,811 | $51,912 | $10,500 | $41,412 |
| 2018 | $2,409 | $51,912 | $10,500 | $41,412 |
| 2017 | $2,418 | $46,736 | $9,608 | $37,128 |
| 2016 | $2,495 | $46,736 | $9,608 | $37,128 |
| 2015 | $2,512 | $46,736 | $9,608 | $37,128 |
| 2014 | $2,445 | $43,680 | $8,980 | $34,700 |
| 2013 | $2,352 | $51,090 | $10,500 | $40,590 |
Source: Public Records
Map
Nearby Homes
- 938 Whispering Pine Way
- 923 Greengate Dr
- 1105 Poplar Hill Dr
- 440 Lake Shore Dr
- 420 Lake Shore Dr
- 538 Lookout Ridge Dr
- 447 Lake Haven Ct
- B Nelson Ln
- 941 Dillon Way
- 781 Shadow Wood Dr
- 1112 Mohawk Dr
- 0 Wilmington Rd Unit 1850287
- 0 Wilmington Rd Unit 940450
- 1251 Poplar Hill Dr
- 1257 Poplar Hill Dr
- 206 Wright Ave
- 440 E Main St
- 378 Forge Dr
- 4377 Waters Edge Ln
- 16 Mound St
- 930 Whispering Pine Way
- 931 Greengate Dr
- 927 Greengate Dr
- 926 Whispering Pine Way
- 942 Whispering Pine Way
- 935 Greengate Dr
- 931 Whispering Pine Way
- 935 Whispering Pine Way
- 927 Whispering Pine Way
- 939 Greengate Dr
- 946 Whispering Pine Way
- 922 Whispering Pine Way
- 939 Whispering Pine Way
- 923 Whispering Pine Way
- 920 Whispering Pine Way
- 919 Greengate Dr
- 943 Greengate Dr
- 943 Whispering Pine Way
- 919 Whispering Pine Way
- 918 Whispering Pine Way