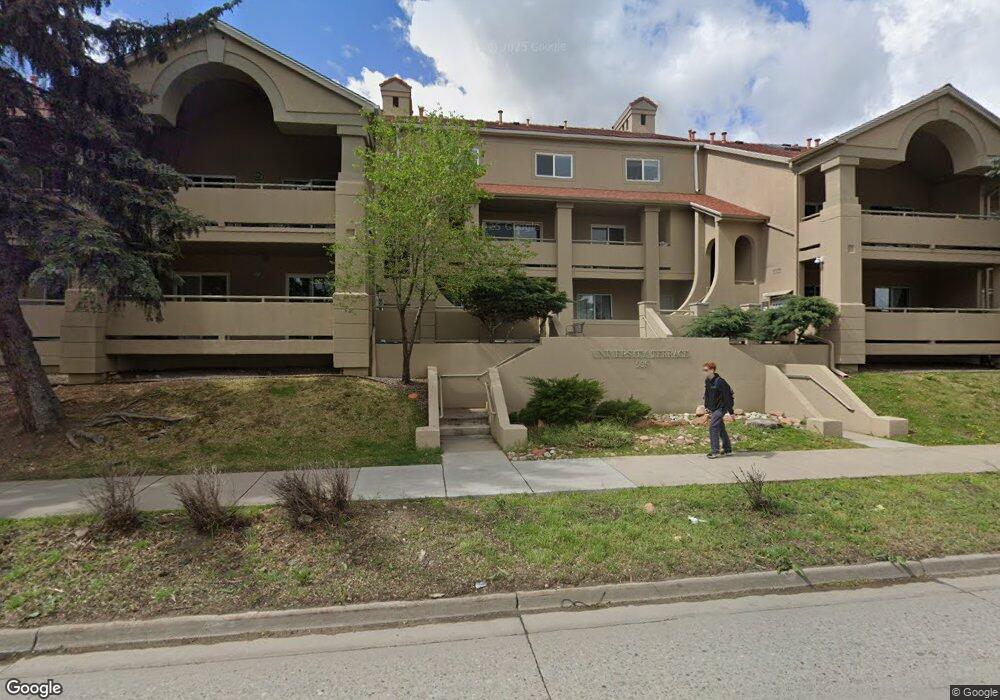
935 Broadway St Unit 203 Boulder, CO 80302
University Hill NeighborhoodEstimated Value: $439,303 - $588,000
2
Beds
1
Bath
660
Sq Ft
$749/Sq Ft
Est. Value
About This Home
This home is located at 935 Broadway St Unit 203, Boulder, CO 80302 and is currently estimated at $494,076, approximately $748 per square foot. 935 Broadway St Unit 203 is a home located in Boulder County with nearby schools including Flatirons Elementary School, Manhattan Middle School of the Arts & Academics, and Boulder High School.
Ownership History
Date
Name
Owned For
Owner Type
Purchase Details
Closed on
Nov 2, 2017
Sold by
Long Caroline A and Binger Caroline A
Bought by
935 Broadway Ii Llc
Current Estimated Value
Purchase Details
Closed on
Jan 1, 2017
Sold by
935 Broadway Llc
Bought by
Binger Caroline A
Purchase Details
Closed on
Oct 17, 2008
Sold by
Binger Matthew M and Binger Caroline A
Bought by
935 Broadway Llc
Purchase Details
Closed on
Jan 10, 2002
Sold by
Binger Matthew M
Bought by
Binger Matthew M
Home Financials for this Owner
Home Financials are based on the most recent Mortgage that was taken out on this home.
Original Mortgage
$143,500
Interest Rate
7.07%
Purchase Details
Closed on
Dec 22, 1992
Bought by
935 Broadway Llc
Purchase Details
Closed on
Sep 19, 1989
Bought by
935 Broadway Llc
Purchase Details
Closed on
Aug 17, 1989
Bought by
935 Broadway Llc
Purchase Details
Closed on
Mar 10, 1989
Bought by
935 Broadway Llc
Create a Home Valuation Report for This Property
The Home Valuation Report is an in-depth analysis detailing your home's value as well as a comparison with similar homes in the area
Home Values in the Area
Average Home Value in this Area
Purchase History
| Date | Buyer | Sale Price | Title Company |
|---|---|---|---|
| 935 Broadway Ii Llc | -- | None Available | |
| Binger Caroline A | -- | None Available | |
| 935 Broadway Llc | -- | None Available | |
| Binger Matthew M | -- | -- | |
| 935 Broadway Llc | $83,700 | -- | |
| 935 Broadway Llc | $63,500 | -- | |
| 935 Broadway Llc | -- | -- | |
| 935 Broadway Llc | $349,500 | -- |
Source: Public Records
Mortgage History
| Date | Status | Borrower | Loan Amount |
|---|---|---|---|
| Previous Owner | Binger Matthew M | $143,500 |
Source: Public Records
Tax History Compared to Growth
Tax History
| Year | Tax Paid | Tax Assessment Tax Assessment Total Assessment is a certain percentage of the fair market value that is determined by local assessors to be the total taxable value of land and additions on the property. | Land | Improvement |
|---|---|---|---|---|
| 2025 | $2,509 | $28,581 | -- | $28,581 |
| 2024 | $2,509 | $28,581 | -- | $28,581 |
| 2023 | $2,463 | $27,653 | -- | $31,338 |
| 2022 | $2,861 | $30,003 | $0 | $30,003 |
| 2021 | $2,732 | $30,867 | $0 | $30,867 |
| 2020 | $2,311 | $26,548 | $0 | $26,548 |
| 2019 | $2,276 | $26,548 | $0 | $26,548 |
| 2018 | $1,944 | $22,421 | $0 | $22,421 |
| 2017 | $1,883 | $24,787 | $0 | $24,787 |
| 2016 | $1,669 | $19,279 | $0 | $19,279 |
| 2015 | $1,580 | $16,780 | $0 | $16,780 |
| 2014 | $1,443 | $16,780 | $0 | $16,780 |
Source: Public Records
Map
Nearby Homes
- 935 Broadway St Unit 104
- 961 16th St Unit 2
- 961 16th St Unit 5
- 772 16th St
- 1085 Broadway St Unit 4
- 845 14th St
- 764 14th St
- 2030 Columbine Ave
- 2119 Mariposa Ave
- 1200 College Ave Unit 123
- 1037 12th St
- 757 12th St
- 650 12th St
- 2207 Bluebell Ave
- 350 15th St
- 2510 Taft Dr Unit 312
- 2510 Taft Dr Unit 205
- 2250 Bluebell Ave
- 1380 Bluebell Ave
- 245 Fair Place
- 935 Broadway St Unit 215
- 935 Broadway St Unit 214
- 935 Broadway St Unit 213
- 935 Broadway St Unit 212
- 935 Broadway St Unit 211
- 935 Broadway St Unit 210
- 935 Broadway St Unit 209
- 935 Broadway St Unit 208
- 935 Broadway St Unit 207
- 935 Broadway St Unit 206
- 935 Broadway St Unit 205
- 935 Broadway St Unit 204
- 935 Broadway St Unit 202
- 935 Broadway St Unit 201
- 935 Broadway St Unit 108
- 935 Broadway St Unit 107
- 935 Broadway St Unit 106
- 935 Broadway St Unit 105
- 935 Broadway St Unit 103
- 935 Broadway St Unit 102