Estimated Value: $526,000 - $670,000
3
Beds
3
Baths
2,140
Sq Ft
$286/Sq Ft
Est. Value
About This Home
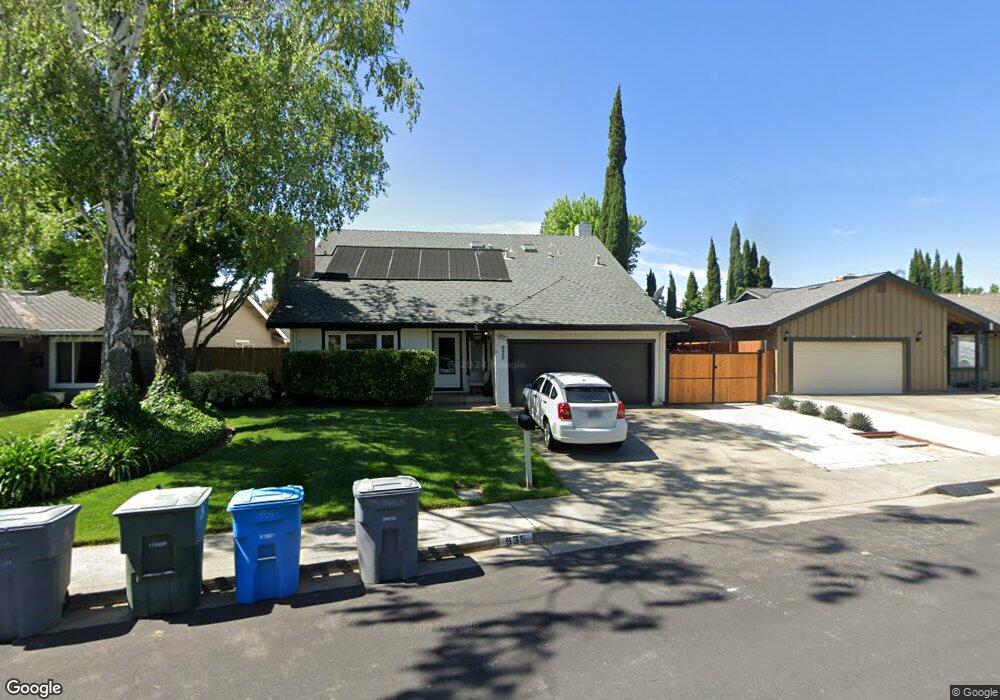
This home is located at 935 Dawson Dr, Dixon, CA 95620 and is currently estimated at $611,608, approximately $285 per square foot. 935 Dawson Dr is a home located in Solano County with nearby schools including Gretchen Higgins Elementary School, Dixon High School, and Dixon Montessori Charter.
Ownership History
Date
Name
Owned For
Owner Type
Purchase Details
Closed on
Jul 15, 2002
Sold by
Coulson Adrian D
Bought by
Coulson Adrian and Bills Leigh L
Current Estimated Value
Home Financials for this Owner
Home Financials are based on the most recent Mortgage that was taken out on this home.
Original Mortgage
$210,000
Outstanding Balance
$88,897
Interest Rate
6.69%
Estimated Equity
$522,711
Purchase Details
Closed on
Sep 26, 2000
Sold by
Fields Robert D and Fields Donna L
Bought by
Coulson Adrian D
Home Financials for this Owner
Home Financials are based on the most recent Mortgage that was taken out on this home.
Original Mortgage
$176,300
Interest Rate
7.98%
Create a Home Valuation Report for This Property
The Home Valuation Report is an in-depth analysis detailing your home's value as well as a comparison with similar homes in the area
Home Values in the Area
Average Home Value in this Area
Purchase History
| Date | Buyer | Sale Price | Title Company |
|---|---|---|---|
| Coulson Adrian | -- | Chicago Title Co | |
| Coulson Adrian D | $220,500 | Frontier Title Company |
Source: Public Records
Mortgage History
| Date | Status | Borrower | Loan Amount |
|---|---|---|---|
| Open | Coulson Adrian | $210,000 | |
| Closed | Coulson Adrian D | $176,300 | |
| Closed | Coulson Adrian | $42,000 |
Source: Public Records
Tax History
| Year | Tax Paid | Tax Assessment Tax Assessment Total Assessment is a certain percentage of the fair market value that is determined by local assessors to be the total taxable value of land and additions on the property. | Land | Improvement |
|---|---|---|---|---|
| 2025 | $3,966 | $353,035 | $82,870 | $270,165 |
| 2024 | $3,966 | $383,813 | $81,246 | $302,567 |
| 2023 | $3,848 | $339,328 | $79,653 | $259,675 |
| 2022 | $3,790 | $332,676 | $78,093 | $254,583 |
| 2021 | $3,742 | $326,154 | $76,562 | $249,592 |
| 2020 | $3,681 | $322,810 | $75,777 | $247,033 |
| 2019 | $3,611 | $316,482 | $74,292 | $242,190 |
| 2018 | $3,594 | $310,278 | $72,836 | $237,442 |
| 2017 | $3,503 | $304,195 | $71,408 | $232,787 |
| 2016 | $3,350 | $298,231 | $70,008 | $228,223 |
| 2015 | $3,273 | $293,752 | $68,957 | $224,795 |
| 2014 | $3,236 | $287,999 | $67,607 | $220,392 |
Source: Public Records
Map
Nearby Homes
Your Personal Tour Guide
Ask me questions while you tour the home.