9352 Fostoria Ct San Diego, CA 92127
4S Ranch NeighborhoodEstimated Value: $2,983,000 - $3,276,000
5
Beds
6
Baths
4,684
Sq Ft
$681/Sq Ft
Est. Value
About This Home
This home is located at 9352 Fostoria Ct, San Diego, CA 92127 and is currently estimated at $3,190,177, approximately $681 per square foot. 9352 Fostoria Ct is a home located in San Diego County with nearby schools including Del Sur Elementary School, Oak Valley Middle, and Del Norte High School.
Ownership History
Date
Name
Owned For
Owner Type
Purchase Details
Closed on
Jul 19, 2013
Sold by
Brengle David R and Brengle Rochele
Bought by
Brengle David R and Brengle Rochele
Current Estimated Value
Purchase Details
Closed on
Sep 7, 2011
Sold by
Brengle David R and Brengle Rochele
Bought by
Brengle David R and Brengle Rochele
Home Financials for this Owner
Home Financials are based on the most recent Mortgage that was taken out on this home.
Original Mortgage
$675,000
Outstanding Balance
$458,465
Interest Rate
4.09%
Mortgage Type
New Conventional
Estimated Equity
$2,731,712
Purchase Details
Closed on
Feb 22, 2010
Sold by
Brengle David R and Brengle Rochele
Bought by
Brengle David R and Brengle Rochele
Home Financials for this Owner
Home Financials are based on the most recent Mortgage that was taken out on this home.
Original Mortgage
$686,600
Interest Rate
4.93%
Mortgage Type
New Conventional
Purchase Details
Closed on
Aug 5, 2002
Sold by
Bernardo Lakes San Diego Lp
Bought by
Brengle David R and Brengle Rochele
Home Financials for this Owner
Home Financials are based on the most recent Mortgage that was taken out on this home.
Original Mortgage
$625,000
Interest Rate
6.05%
Create a Home Valuation Report for This Property
The Home Valuation Report is an in-depth analysis detailing your home's value as well as a comparison with similar homes in the area
Home Values in the Area
Average Home Value in this Area
Purchase History
| Date | Buyer | Sale Price | Title Company |
|---|---|---|---|
| Brengle David R | -- | None Available | |
| Brengle David R | -- | None Available | |
| Brengle David R | -- | Western Resources Title | |
| Brengle David R | -- | Western Resources Title | |
| Brengle David R | -- | Accommodation | |
| Brengle David R | -- | Ticor Title Company | |
| Brengle David R | $844,500 | Chicago Title Co |
Source: Public Records
Mortgage History
| Date | Status | Borrower | Loan Amount |
|---|---|---|---|
| Open | Brengle David R | $675,000 | |
| Closed | Brengle David R | $686,600 | |
| Previous Owner | Brengle David R | $625,000 |
Source: Public Records
Tax History Compared to Growth
Tax History
| Year | Tax Paid | Tax Assessment Tax Assessment Total Assessment is a certain percentage of the fair market value that is determined by local assessors to be the total taxable value of land and additions on the property. | Land | Improvement |
|---|---|---|---|---|
| 2025 | $19,316 | $1,378,792 | $398,280 | $980,512 |
| 2024 | $19,316 | $1,351,758 | $390,471 | $961,287 |
| 2023 | $18,780 | $1,325,254 | $382,815 | $942,439 |
| 2022 | $18,500 | $1,299,269 | $375,309 | $923,960 |
| 2021 | $18,180 | $1,273,794 | $367,950 | $905,844 |
| 2020 | $17,979 | $1,260,734 | $364,178 | $896,556 |
| 2019 | $17,581 | $1,236,015 | $357,038 | $878,977 |
| 2018 | $17,168 | $1,211,781 | $350,038 | $861,743 |
| 2017 | $16,858 | $1,188,022 | $343,175 | $844,847 |
| 2016 | $16,964 | $1,164,729 | $336,447 | $828,282 |
| 2015 | $16,540 | $1,147,235 | $331,394 | $815,841 |
| 2014 | $16,195 | $1,124,763 | $324,903 | $799,860 |
Source: Public Records
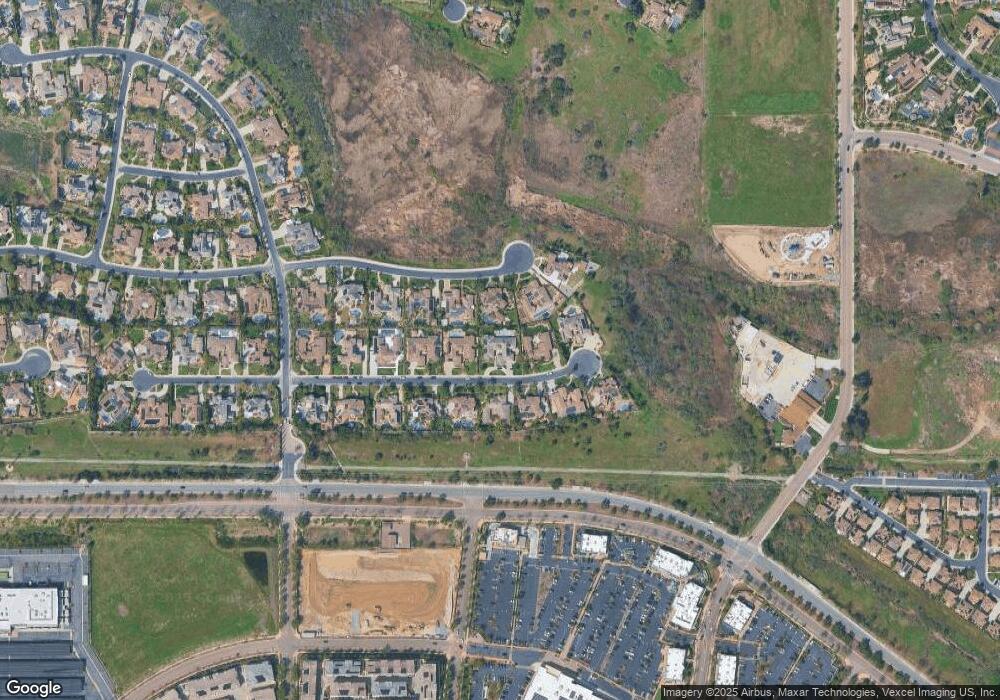
Map
Nearby Homes
- 9343 Bernardo Lakes Dr
- 17117 Tallow Tree Ln
- Artesian Rd & End of Camino Lima
- Artesian Rd Camino Lima Parcel 33
- Artesian Rd & Camino Lima Parcel -32
- Lot #1 Trailside Ln
- Artesian Rd & Camino Lima (Corner Lot 34)
- Lot #2 Trailside Ln
- 16750 Coyote Bush Dr Unit 47
- 16750 Coyote Bush Dr Unit 107
- 16750 Coyote Bush Dr Unit 31
- 16750 Coyote Bush Dr Unit 19
- 15105 Lincoln Loop
- 15929 Parkview Loop
- 0 Camino Santa fe Dr Unit 21 250034399
- 15653 Tanner Ridge Rd
- 10237 Paseo de Linda
- 10214 Sienna Hills Dr
- 16935 Laurel Hill Ln Unit 171
- 15809 Concord Ridge Terrace
- 9340 Fostoria Ct
- 9364 Fostoria Ct
- 9351 Bernardo Lakes Dr
- 9349 Fostoria Ct
- 9359 Bernardo Lakes Dr
- 9357 Fostoria Ct
- 9341 Fostoria Ct
- 9332 Fostoria Ct
- 9376 Fostoria Ct
- 9365 Fostoria Ct
- 9335 Bernardo Lakes Dr
- 1 A Run of the Knolls
- 38 5 Sendero de Alba
- 7808 Top O the Morning Way
- 16514 Road To Morocco
- 3 .17AC RIO VIST Rio Vista Rd
- 0 2.52 AC Artesian Rd
- 8249 Top of the Morning Dr
- 8242 Top O the Morning
- 2 .44 AC Cam Del Vientecito