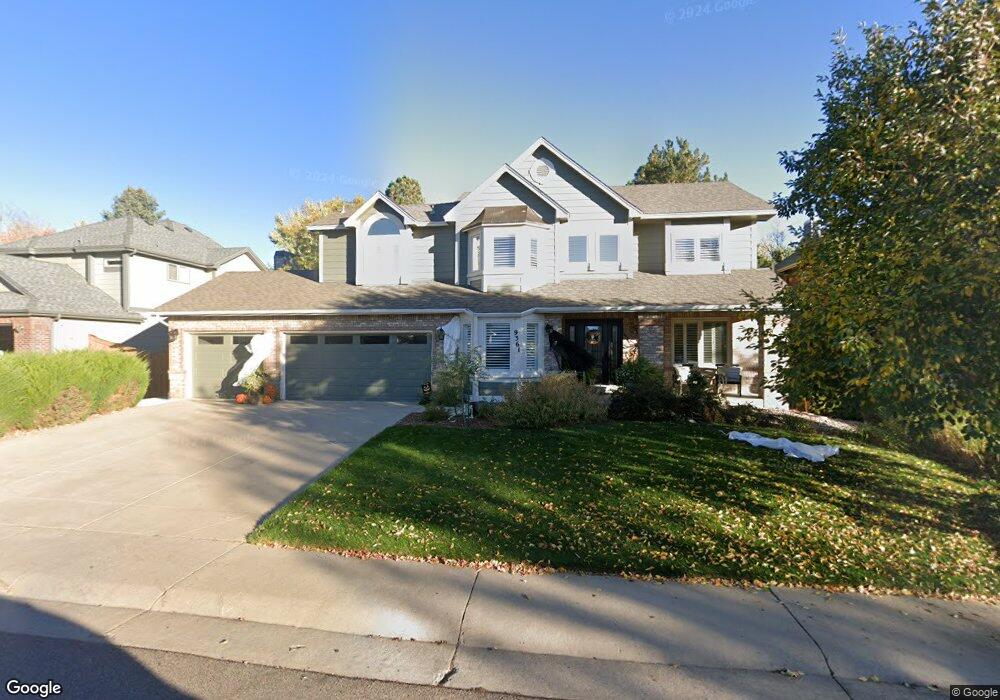
9361 Cornell Cir Highlands Ranch, CO 80130
Eastridge NeighborhoodEstimated Value: $710,000 - $826,000
4
Beds
3
Baths
2,554
Sq Ft
$295/Sq Ft
Est. Value
About This Home
This home is located at 9361 Cornell Cir, Highlands Ranch, CO 80130 and is currently estimated at $754,182, approximately $295 per square foot. 9361 Cornell Cir is a home located in Douglas County with nearby schools including Fox Creek Elementary School, Cresthill Middle School, and Highlands Ranch High School.
Ownership History
Date
Name
Owned For
Owner Type
Purchase Details
Closed on
Nov 2, 2006
Sold by
Anttila David W and Svoboda Cherie A
Bought by
Anttila David W and Anttila Cherie S
Current Estimated Value
Home Financials for this Owner
Home Financials are based on the most recent Mortgage that was taken out on this home.
Original Mortgage
$336,000
Outstanding Balance
$199,527
Interest Rate
6.28%
Mortgage Type
New Conventional
Estimated Equity
$554,655
Purchase Details
Closed on
Feb 5, 1991
Sold by
Nationwide Mutual Ins Co
Bought by
Anttila David W and Svobada Cherie A
Purchase Details
Closed on
Oct 19, 1990
Sold by
Sheldon Gerald L and Sheldon Ann E
Bought by
Nationwide Mutual Lins Co
Purchase Details
Closed on
Feb 21, 1989
Sold by
Richmond Homes Ltd
Bought by
Sheldon Gerald L and Sheldon Ann E
Create a Home Valuation Report for This Property
The Home Valuation Report is an in-depth analysis detailing your home's value as well as a comparison with similar homes in the area
Home Values in the Area
Average Home Value in this Area
Purchase History
| Date | Buyer | Sale Price | Title Company |
|---|---|---|---|
| Anttila David W | -- | None Available | |
| Anttila David W | $169,900 | -- | |
| Nationwide Mutual Lins Co | $172,000 | -- | |
| Sheldon Gerald L | $154,000 | -- | |
| Richmond Homes Ltd | -- | -- |
Source: Public Records
Mortgage History
| Date | Status | Borrower | Loan Amount |
|---|---|---|---|
| Open | Anttila David W | $336,000 |
Source: Public Records
Tax History Compared to Growth
Tax History
| Year | Tax Paid | Tax Assessment Tax Assessment Total Assessment is a certain percentage of the fair market value that is determined by local assessors to be the total taxable value of land and additions on the property. | Land | Improvement |
|---|---|---|---|---|
| 2024 | $4,673 | $53,270 | $11,200 | $42,070 |
| 2023 | $4,665 | $53,270 | $11,200 | $42,070 |
| 2022 | $3,598 | $39,380 | $7,590 | $31,790 |
| 2021 | $3,742 | $39,380 | $7,590 | $31,790 |
| 2020 | $3,396 | $36,620 | $7,290 | $29,330 |
| 2019 | $3,409 | $36,620 | $7,290 | $29,330 |
| 2018 | $3,196 | $33,820 | $6,340 | $27,480 |
| 2017 | $2,910 | $33,820 | $6,340 | $27,480 |
| 2016 | $2,884 | $32,890 | $6,450 | $26,440 |
| 2015 | $2,946 | $32,890 | $6,450 | $26,440 |
| 2014 | $2,500 | $25,770 | $4,780 | $20,990 |
Source: Public Records
Map
Nearby Homes
- 6111 Trailhead Rd
- 6109 Trailhead Rd
- 6141 Trailhead Rd
- 6239 Trailhead Rd
- 9368 Harvard Dr
- 9390 Yale Ln
- 6426 Nassau Ct
- 6723 Amherst Ct
- 9222 Buttonhill Ct
- 6266 Nassau Ct
- 16 Shetland Ct
- 6482 Silver Mesa Dr Unit B
- 6444 Silver Mesa Dr Unit A
- 6717 Millstone St
- 5418 Shetland Ct
- 6434 Silver Mesa Dr Unit C
- 9323 Weeping Willow Place
- 6887 Chestnut Hill St
- 9275 Erminedale Dr
- 6 Abernathy Ct
- 9357 Cornell Cir
- 9365 Cornell Cir
- 9301 Princeton Ln
- 9353 Cornell Cir
- 9369 Cornell Cir
- 9311 Princeton Ln
- 6334 Columbia Dr
- 9362 Cornell Cir
- 9358 Cornell Cir
- 9366 Cornell Cir
- 9366 Cornell Cir Unit Cornell Cir
- 9321 Princeton Ln
- 6354 Columbia Dr
- 9349 Cornell Cir
- 9370 Cornell Cir
- 6275 Collegiate Dr
- 9331 Princeton Ln
- 6364 Columbia Dr
- 6295 Collegiate Dr
- 9346 Cornell Cir