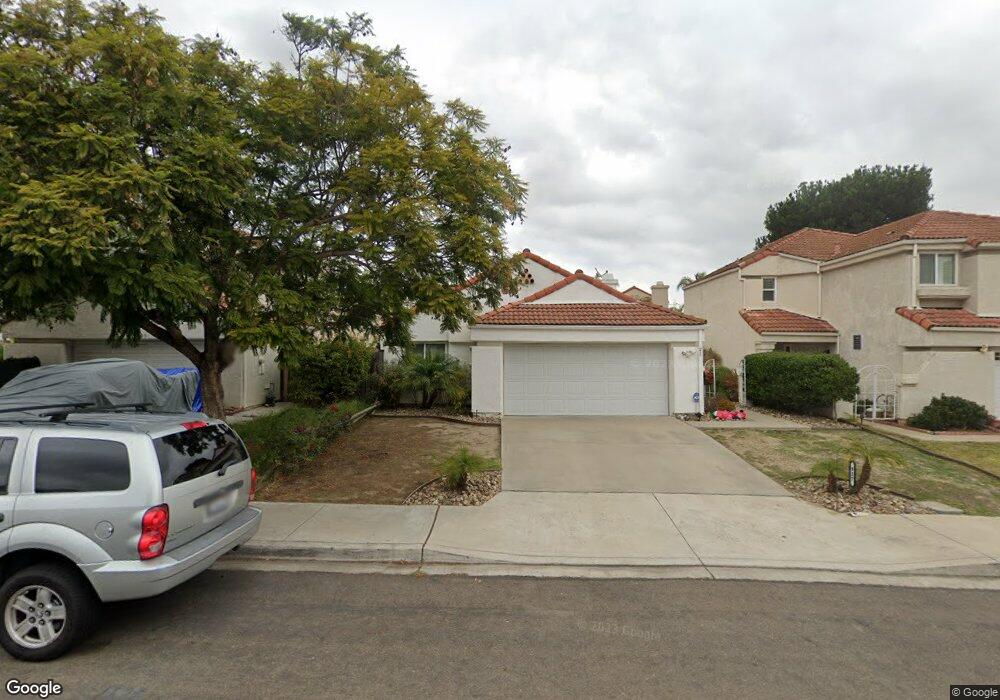
937 Redbud Rd Chula Vista, CA 91910
Rancho Del Rey NeighborhoodEstimated Value: $819,032 - $928,000
3
Beds
2
Baths
1,458
Sq Ft
$604/Sq Ft
Est. Value
About This Home
This home is located at 937 Redbud Rd, Chula Vista, CA 91910 and is currently estimated at $880,758, approximately $604 per square foot. 937 Redbud Rd is a home located in San Diego County with nearby schools including Casillas Elementary School, Rancho Del Rey Middle School, and Otay Ranch Senior High School.
Ownership History
Date
Name
Owned For
Owner Type
Purchase Details
Closed on
Oct 15, 2010
Sold by
Macapugay Benjamin T
Bought by
Macapugay Kirin A
Current Estimated Value
Purchase Details
Closed on
Jun 23, 2010
Sold by
Lee Ken Ta Yang and Lee Yi Chien
Bought by
Macapugay Benjamin T and Macapugay Kirin A
Home Financials for this Owner
Home Financials are based on the most recent Mortgage that was taken out on this home.
Original Mortgage
$345,349
Outstanding Balance
$227,790
Interest Rate
4.65%
Mortgage Type
FHA
Estimated Equity
$652,968
Purchase Details
Closed on
Sep 17, 1997
Sold by
Yang Lee Ken Ta
Bought by
Lee Ken Ta Yang and Lee Yi Chien
Purchase Details
Closed on
Sep 12, 1996
Sold by
Lee Yi Chien
Bought by
Ta Yang Ken
Purchase Details
Closed on
Aug 28, 1987
Purchase Details
Closed on
Oct 12, 1984
Create a Home Valuation Report for This Property
The Home Valuation Report is an in-depth analysis detailing your home's value as well as a comparison with similar homes in the area
Home Values in the Area
Average Home Value in this Area
Purchase History
| Date | Buyer | Sale Price | Title Company |
|---|---|---|---|
| Macapugay Kirin A | -- | None Available | |
| Macapugay Benjamin T | $350,000 | Lawyers Title Company | |
| Lee Ken Ta Yang | -- | -- | |
| Ta Yang Ken | -- | First American Title Ins Co | |
| -- | $135,000 | -- | |
| -- | $110,900 | -- |
Source: Public Records
Mortgage History
| Date | Status | Borrower | Loan Amount |
|---|---|---|---|
| Open | Macapugay Benjamin T | $345,349 |
Source: Public Records
Tax History Compared to Growth
Tax History
| Year | Tax Paid | Tax Assessment Tax Assessment Total Assessment is a certain percentage of the fair market value that is determined by local assessors to be the total taxable value of land and additions on the property. | Land | Improvement |
|---|---|---|---|---|
| 2025 | $5,276 | $448,399 | $230,606 | $217,793 |
| 2024 | $5,276 | $439,608 | $226,085 | $213,523 |
| 2023 | $5,199 | $430,989 | $221,652 | $209,337 |
| 2022 | $5,048 | $422,539 | $217,306 | $205,233 |
| 2021 | $4,932 | $414,255 | $213,046 | $201,209 |
| 2020 | $4,816 | $410,008 | $210,862 | $199,146 |
| 2019 | $4,691 | $401,970 | $206,728 | $195,242 |
| 2018 | $4,616 | $394,089 | $202,675 | $191,414 |
| 2017 | $13 | $386,362 | $198,701 | $187,661 |
| 2016 | $4,404 | $378,787 | $194,805 | $183,982 |
| 2015 | $4,191 | $360,000 | $184,000 | $176,000 |
| 2014 | $3,961 | $340,000 | $174,000 | $166,000 |
Source: Public Records
Map
Nearby Homes
- 1002 Cholla Place
- 1029 Vista Oak Place
- 820 Chervil Ct
- 694 Calma Place
- 1008 Calma Dr
- 843 Calle Ciela Vista Unit 20
- 1057 Paseo Del Norte
- 1060 Via Sinuoso
- 626 Mariposa Cir
- 640 E J St
- 1112 Camino Del Rey
- 578 Nantucket Dr
- 793 Vada St Unit 2
- 713 Esla Dr
- 491 Nanette St
- 728 Cardona Ave
- 486 E Naples St
- 554 Telegraph Canyon Rd Unit F
- 548 Telegraph Canyon Rd Unit D
- 1337 Santa Olivia Rd
- 939 Redbud Rd
- 935 Redbud Rd
- 941 Redbud Rd
- 933 Redbud Rd
- 828 Cedarbend Way
- 830 Cedarbend Way
- 826 Cedarbend Way
- 931 Redbud Rd
- 943 Redbud Rd Unit B
- 832 Cedarbend Way
- 824 Cedarbend Way
- 836 Cedarbend Way
- 929 Redbud Rd
- 820 Cedarbend Way
- 945 Redbud Rd
- 936 Redbud Rd
- 938 Redbud Rd
- 934 Redbud Rd
- 838 Cedarbend Way
- 940 Redbud Rd