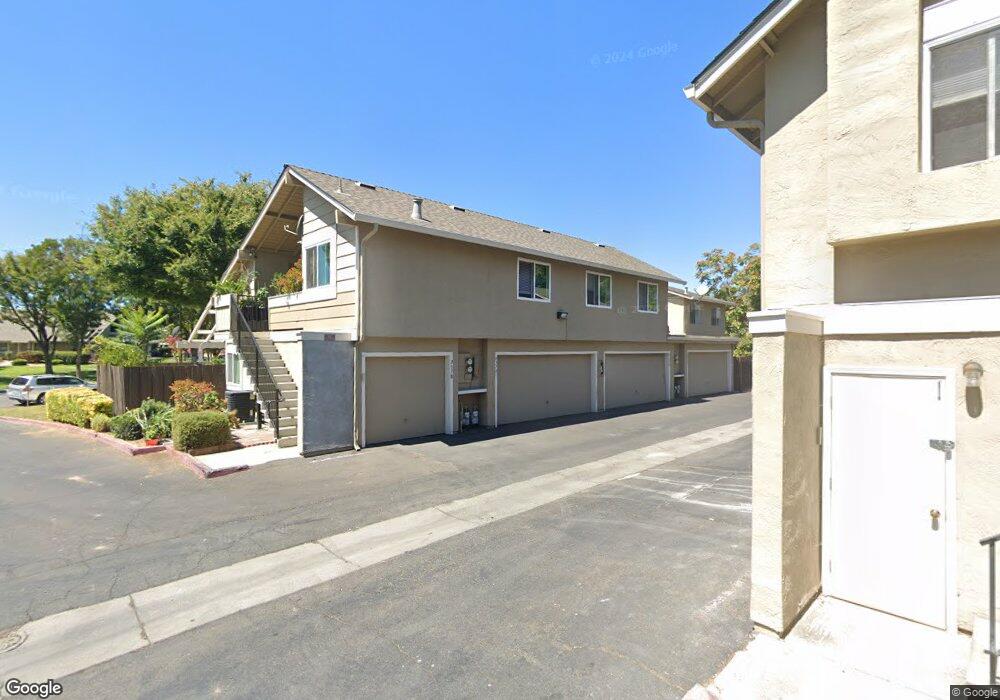
937 Summerside Dr Unit C San Jose, CA 95122
Yerba Buena NeighborhoodEstimated Value: $643,000 - $729,000
3
Beds
2
Baths
1,165
Sq Ft
$593/Sq Ft
Est. Value
About This Home
This home is located at 937 Summerside Dr Unit C, San Jose, CA 95122 and is currently estimated at $690,836, approximately $592 per square foot. 937 Summerside Dr Unit C is a home located in Santa Clara County with nearby schools including Stonegate Elementary School, Sylvandale Middle School, and Yerba Buena High School.
Ownership History
Date
Name
Owned For
Owner Type
Purchase Details
Closed on
May 31, 2023
Sold by
Bui Christine Kim
Bought by
Christine K Bui Family Living Trust
Current Estimated Value
Purchase Details
Closed on
Mar 20, 2008
Sold by
Us Bank Na
Bought by
Salinas Robert Brian and Salinas Christina
Home Financials for this Owner
Home Financials are based on the most recent Mortgage that was taken out on this home.
Original Mortgage
$276,000
Interest Rate
5.12%
Mortgage Type
Purchase Money Mortgage
Purchase Details
Closed on
Mar 7, 1994
Sold by
Sweeny Mark Michael
Bought by
Bul Christine Kim
Home Financials for this Owner
Home Financials are based on the most recent Mortgage that was taken out on this home.
Original Mortgage
$103,200
Interest Rate
7%
Create a Home Valuation Report for This Property
The Home Valuation Report is an in-depth analysis detailing your home's value as well as a comparison with similar homes in the area
Home Values in the Area
Average Home Value in this Area
Purchase History
| Date | Buyer | Sale Price | Title Company |
|---|---|---|---|
| Christine K Bui Family Living Trust | -- | None Listed On Document | |
| Salinas Robert Brian | $345,000 | Old Republic Title Company | |
| Bul Christine Kim | $129,000 | First American Title Guarant |
Source: Public Records
Mortgage History
| Date | Status | Borrower | Loan Amount |
|---|---|---|---|
| Previous Owner | Salinas Robert Brian | $276,000 | |
| Previous Owner | Bul Christine Kim | $103,200 |
Source: Public Records
Tax History Compared to Growth
Tax History
| Year | Tax Paid | Tax Assessment Tax Assessment Total Assessment is a certain percentage of the fair market value that is determined by local assessors to be the total taxable value of land and additions on the property. | Land | Improvement |
|---|---|---|---|---|
| 2025 | $4,066 | $215,643 | $85,980 | $129,663 |
| 2024 | $4,066 | $211,416 | $84,295 | $127,121 |
| 2023 | $3,902 | $207,272 | $82,643 | $124,629 |
| 2022 | $3,821 | $203,209 | $81,023 | $122,186 |
| 2021 | $3,760 | $199,226 | $79,435 | $119,791 |
| 2020 | $3,557 | $197,184 | $78,621 | $118,563 |
| 2019 | $3,405 | $193,319 | $77,080 | $116,239 |
| 2018 | $3,382 | $189,529 | $75,569 | $113,960 |
| 2017 | $3,331 | $185,814 | $74,088 | $111,726 |
| 2016 | $3,167 | $182,172 | $72,636 | $109,536 |
| 2015 | $3,104 | $179,436 | $71,545 | $107,891 |
| 2014 | $2,628 | $175,922 | $70,144 | $105,778 |
Source: Public Records
Map
Nearby Homes
- 2102 Galveston Ave Unit A
- 2102 Galveston Ave Unit B
- 988 Summerplace Dr
- 2175 Summerton Dr
- 1042 Summermist Ct Unit 107
- 1034 Summerplace Dr
- 1050 Summermist Ct
- 1117 Indian Summer Ct
- 1087 Summerain Ct
- 1058 Tekman Dr Unit 58
- 2416 Balme Dr
- 2015 Tahiti Ct
- 1231 Turtlerock Dr
- 963 Mills Corner Ln
- 1887 Aberdeen Ct
- 1381 Taper Ct
- 2566 Boren Dr
- 1714 Bevin Brook Dr
- 1704 Bevin Brook Dr
- 2580 Senter Rd Unit 455
- 937 Summerside Dr Unit D
- 937 Summerside Dr Unit D
- 937 Summerside Dr Unit B
- 937 Summerside Dr Unit A
- 941 Summerside Dr Unit B
- 941 Summerside Dr Unit D
- 941 Summerside Dr Unit C
- 941 Summerside Dr Unit B
- 941 Summerside Dr Unit A
- 945 Summerside Dr Unit D
- 945 Summerside Dr Unit C
- 945 Summerside Dr Unit B
- 945 Summerside Dr Unit A
- 864 Paseo Estero Dr
- 862 Paseo Estero Dr
- 860 Paseo Estero Dr
- 858 Paseo Estero Dr
- 866 Paseo Estero Dr
- 868 Paseo Estero Dr
- 856 Paseo Estero Dr