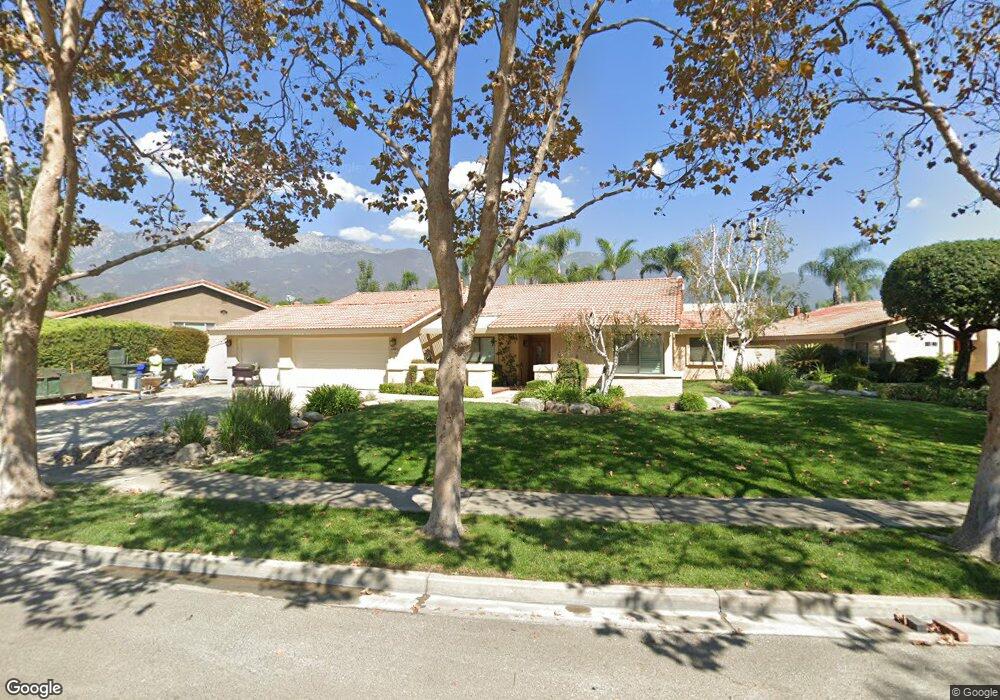
9370 Apricot Ave Rancho Cucamonga, CA 91701
Estimated Value: $870,840 - $955,000
4
Beds
2
Baths
2,068
Sq Ft
$446/Sq Ft
Est. Value
About This Home
This home is located at 9370 Apricot Ave, Rancho Cucamonga, CA 91701 and is currently estimated at $923,210, approximately $446 per square foot. 9370 Apricot Ave is a home located in San Bernardino County with nearby schools including Carnelian Elementary, Alta Loma Junior High, and Alta Loma High.
Ownership History
Date
Name
Owned For
Owner Type
Purchase Details
Closed on
Jun 21, 2023
Sold by
Riley Allen D and Riley Loraina D
Bought by
Allen And Loraina Riley Family Living Trust and Riley
Current Estimated Value
Create a Home Valuation Report for This Property
The Home Valuation Report is an in-depth analysis detailing your home's value as well as a comparison with similar homes in the area
Home Values in the Area
Average Home Value in this Area
Purchase History
| Date | Buyer | Sale Price | Title Company |
|---|---|---|---|
| Allen And Loraina Riley Family Living Trust | -- | None Listed On Document |
Source: Public Records
Tax History Compared to Growth
Tax History
| Year | Tax Paid | Tax Assessment Tax Assessment Total Assessment is a certain percentage of the fair market value that is determined by local assessors to be the total taxable value of land and additions on the property. | Land | Improvement |
|---|---|---|---|---|
| 2025 | $1,802 | $162,987 | $21,212 | $141,775 |
| 2024 | $1,802 | $159,791 | $20,796 | $138,995 |
| 2023 | $1,686 | $156,658 | $20,388 | $136,270 |
| 2022 | $1,680 | $153,586 | $19,988 | $133,598 |
| 2021 | $1,677 | $150,574 | $19,596 | $130,978 |
| 2020 | $1,609 | $149,030 | $19,395 | $129,635 |
| 2019 | $1,625 | $146,108 | $19,015 | $127,093 |
| 2018 | $1,588 | $143,243 | $18,642 | $124,601 |
| 2017 | $1,516 | $140,434 | $18,276 | $122,158 |
| 2016 | $1,474 | $137,681 | $17,918 | $119,763 |
| 2015 | $1,463 | $135,613 | $17,649 | $117,964 |
| 2014 | $1,421 | $132,956 | $17,303 | $115,653 |
Source: Public Records
Map
Nearby Homes
- 6314 Hellman Ave
- 9504 Lemon Ave
- 6055 Amethyst Ave
- 6028 Amethyst St
- 6154 Klusman Ave
- 9637 Apricot Ave
- 6155 Klusman Ave
- 9513 Sunflower St
- 6036 Eastwood Ave
- 6620 Altawoods Way
- 9160 Garden St
- 6616 Brighton Place
- 6360 Calle Hermoso
- 9872 Highland Ave Unit D
- 9872 Highland Ave Unit B
- 6340 Sacramento Ave
- 8990 19th St Unit 304
- 8990 19th St Unit 201
- 8990 19th St Unit 236
- 8990 19th St Unit 314
- 9388 Apricot Ave
- 6235 Kirkwood Ave
- 9387 La Gloria Dr
- 9379 La Gloria Dr
- 9400 Apricot Ave
- 6215 Kirkwood Ave
- 9381 Apricot Ave
- 9369 Apricot Ave
- 9359 Apricot Ave
- 9397 La Gloria Dr
- 9393 Apricot Ave
- 6230 Kirkwood Ave
- 9414 Apricot Ave
- 6205 Kirkwood Ave
- 9378 La Gloria Dr
- 9409 Apricot Ave
- 6220 Kirkwood Ave
- 9335 Apricot Ave
- 9413 La Gloria Dr
- 9382 Lemon Ave