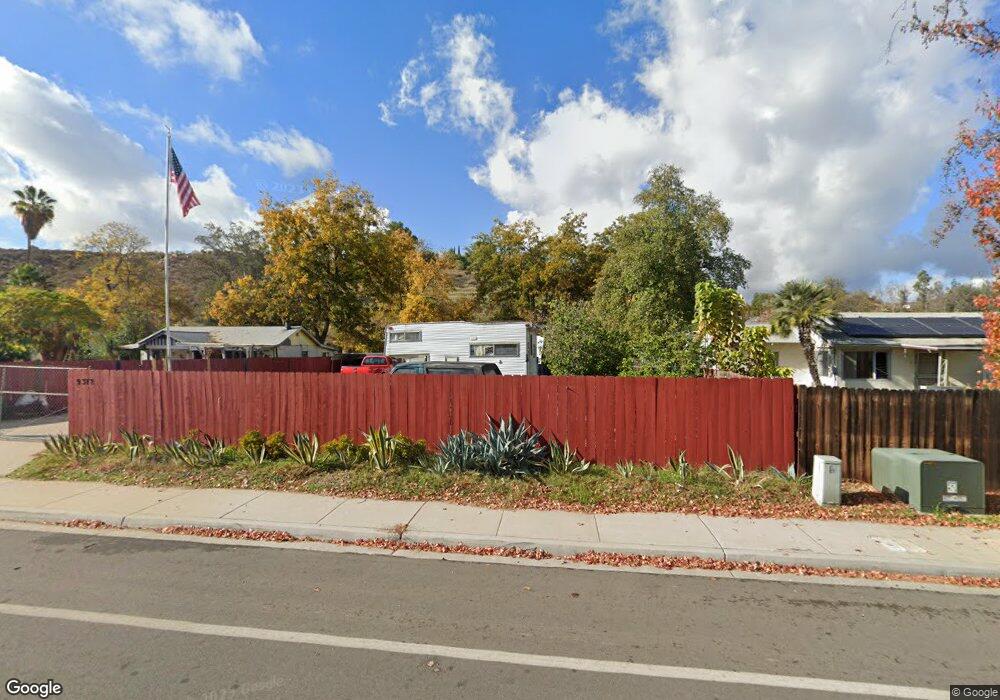
9372 Los Coches Rd Lakeside, CA 92040
Estimated Value: $712,000 - $888,000
3
Beds
2
Baths
1,753
Sq Ft
$470/Sq Ft
Est. Value
About This Home
This home is located at 9372 Los Coches Rd, Lakeside, CA 92040 and is currently estimated at $824,675, approximately $470 per square foot. 9372 Los Coches Rd is a home located in San Diego County with nearby schools including Lemon Crest Elementary School, Tierra Del Sol Middle School, and El Capitan High School.
Ownership History
Date
Name
Owned For
Owner Type
Purchase Details
Closed on
Jun 14, 2001
Sold by
Va
Bought by
Banks William H and Banks Josephine L
Current Estimated Value
Home Financials for this Owner
Home Financials are based on the most recent Mortgage that was taken out on this home.
Original Mortgage
$217,000
Outstanding Balance
$82,720
Interest Rate
7.15%
Estimated Equity
$741,955
Purchase Details
Closed on
Aug 12, 1997
Sold by
Coble Thomas and Coble Stacy K
Bought by
Va
Purchase Details
Closed on
Oct 4, 1996
Sold by
Zenger Peggy Dormer
Bought by
Coble Thomas and Coble Stacy K
Home Financials for this Owner
Home Financials are based on the most recent Mortgage that was taken out on this home.
Original Mortgage
$23,000
Interest Rate
7.76%
Mortgage Type
Seller Take Back
Create a Home Valuation Report for This Property
The Home Valuation Report is an in-depth analysis detailing your home's value as well as a comparison with similar homes in the area
Home Values in the Area
Average Home Value in this Area
Purchase History
We collect this data history from publicly available records. To have your information removed, we recommend requesting removal directly through your county’s website.
| Date | Buyer | Sale Price | Title Company |
|---|---|---|---|
| Banks William H | -- | Commonwealth Land Title Co | |
| Va | $193,000 | First American Title | |
| Coble Thomas | $43,000 | North American Title Company |
Source: Public Records
Mortgage History
We collect this data history from publicly available records. To have your information removed, we recommend requesting removal directly through your county’s website.
| Date | Status | Borrower | Loan Amount |
|---|---|---|---|
| Open | Banks William H | $217,000 | |
| Previous Owner | Coble Thomas | $23,000 |
Source: Public Records
Tax History
| Year | Tax Paid | Tax Assessment Tax Assessment Total Assessment is a certain percentage of the fair market value that is determined by local assessors to be the total taxable value of land and additions on the property. | Land | Improvement |
|---|---|---|---|---|
| 2025 | $2,667 | $338,854 | $111,757 | $227,097 |
| 2024 | $2,667 | $332,211 | $109,566 | $222,645 |
| 2023 | $2,623 | $325,698 | $107,418 | $218,280 |
| 2022 | $2,653 | $319,312 | $105,312 | $214,000 |
| 2021 | $2,615 | $313,052 | $103,248 | $209,804 |
| 2020 | $2,581 | $309,843 | $102,190 | $207,653 |
| 2019 | $4,114 | $303,769 | $100,187 | $203,582 |
| 2018 | $4,019 | $297,814 | $98,223 | $199,591 |
| 2017 | $822 | $291,976 | $96,298 | $195,678 |
| 2016 | $3,792 | $286,252 | $94,410 | $191,842 |
| 2015 | $3,773 | $281,953 | $92,992 | $188,961 |
| 2014 | $3,600 | $276,431 | $91,171 | $185,260 |
Source: Public Records
Map
Nearby Homes
- 9391 Los Coches Rd
- 12895 Meseta Ln
- 12886 Castle Court Dr
- 12325 Lemon Crest Dr
- 12327 Lemon Crest Dr
- 12429 Julian Ave
- 12652 Julian Ave
- 12706 Julian Ave
- 13104 Lakeview Granada Dr
- 9100 Single Oak Dr Unit 67
- 9100 Single Oak Dr Unit 33
- 9100 Single Oak Dr Unit 23
- 9100 Single Oak Dr Unit 11
- 9100 Single Oak Dr Unit 114
- 9100 Single Oak Dr Unit 88
- 12184 Knoll Crest Place
- 12752 Lindo Ln
- 0 Los Coches Rd Unit 260005481
- 12120 Rockcrest Rd
- 12661 Ridgeton Dr
- 9366 Los Coches Rd
- 9378 Los Coches Rd
- 9382 Los Coches Rd
- 9358 Los Coches Rd
- 9386 Los Coches Rd
- 9387 Los C Road
- 9387 Los Coches Road Unit Parcels 2, Parcel Ma
- 9388 Los Coches Rd
- 9383 Los Coches Rd
- 9407 Los Coches Rd Unit 1
- 9407 Los Coches Rd
- 9407 Los Coches Rd
- 12612 Shayann Ln
- 12559 Del Sol Rd
- 9369 Los Coches Rd
- 12624 Shayann Ln
- 9352 Little Ln
- 9387 Los Coches Rd Unit 2
- 9387 Los Coches Rd Unit 2 and 3
- 9387 Los Coches Rd Unit Parcel 2 of Parcel M
Your Personal Tour Guide
Ask me questions while you tour the home.