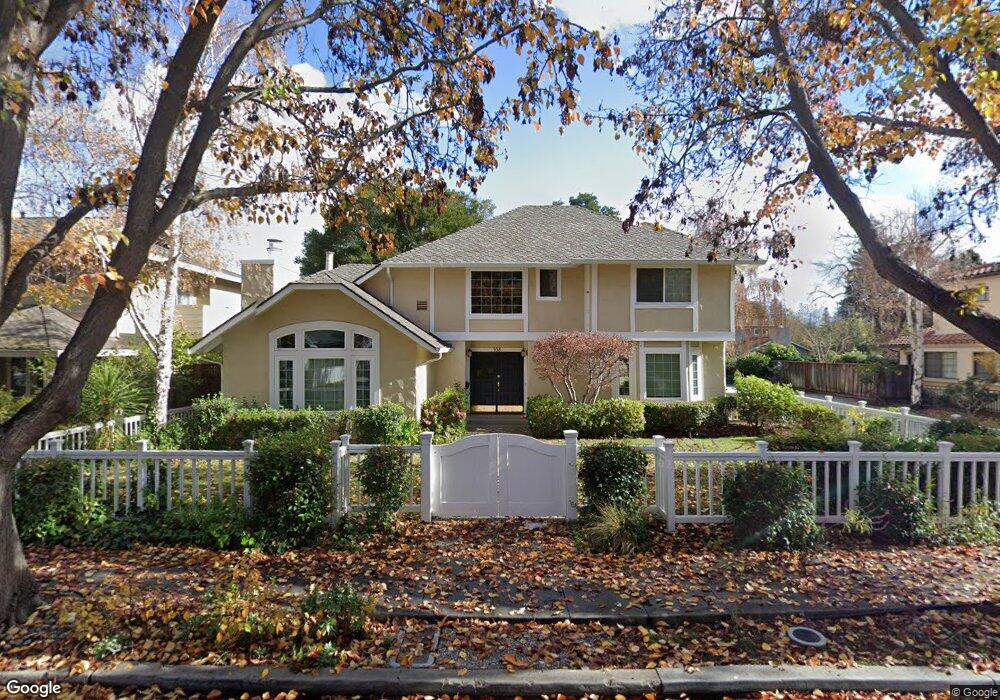
938 Addison Ave Palo Alto, CA 94301
Crescent Park NeighborhoodEstimated Value: $4,713,033 - $5,918,000
4
Beds
3
Baths
2,701
Sq Ft
$1,958/Sq Ft
Est. Value
About This Home
This home is located at 938 Addison Ave, Palo Alto, CA 94301 and is currently estimated at $5,287,758, approximately $1,957 per square foot. 938 Addison Ave is a home located in Santa Clara County with nearby schools including Addison Elementary School, Frank S. Greene Jr. Middle, and Palo Alto High School.
Ownership History
Date
Name
Owned For
Owner Type
Purchase Details
Closed on
Sep 23, 2020
Sold by
Zhang Michael Y and Lu Jean Q
Bought by
Michael Yimin Zhang And Jean Qing Lu Revocabl and Zhang
Current Estimated Value
Home Financials for this Owner
Home Financials are based on the most recent Mortgage that was taken out on this home.
Original Mortgage
$600,000
Interest Rate
2.9%
Mortgage Type
New Conventional
Purchase Details
Closed on
Sep 7, 2010
Sold by
Lacy Joseph R
Bought by
Zhang Michael Y and Lu Jean Q
Home Financials for this Owner
Home Financials are based on the most recent Mortgage that was taken out on this home.
Original Mortgage
$1,500,000
Interest Rate
3.77%
Mortgage Type
New Conventional
Purchase Details
Closed on
Nov 14, 2007
Sold by
Lacy Joseph R
Bought by
Lacy Joseph R and The Joseph R Lacy Revocable Living Trust
Purchase Details
Closed on
Dec 8, 1998
Sold by
Lacy Joseph R and Lacy Patricia B
Bought by
Lacy Joseph R and Lacy Patricia Blair
Create a Home Valuation Report for This Property
The Home Valuation Report is an in-depth analysis detailing your home's value as well as a comparison with similar homes in the area
Home Values in the Area
Average Home Value in this Area
Purchase History
| Date | Buyer | Sale Price | Title Company |
|---|---|---|---|
| Michael Yimin Zhang And Jean Qing Lu Revocabl | -- | Chicago Title | |
| Zhang Michael Y | $2,025,000 | Chicago Title Company | |
| Lacy Joseph R | -- | None Available | |
| Lacy Joseph R | -- | -- |
Source: Public Records
Mortgage History
| Date | Status | Borrower | Loan Amount |
|---|---|---|---|
| Closed | Michael Yimin Zhang And Jean Qing Lu Revocabl | $600,000 | |
| Open | Michael Yimin Zhang And Jean Qing Lu Revocabl | $1,532,000 | |
| Previous Owner | Zhang Michael Y | $1,500,000 |
Source: Public Records
Tax History Compared to Growth
Tax History
| Year | Tax Paid | Tax Assessment Tax Assessment Total Assessment is a certain percentage of the fair market value that is determined by local assessors to be the total taxable value of land and additions on the property. | Land | Improvement |
|---|---|---|---|---|
| 2025 | $30,805 | $2,594,374 | $2,049,879 | $544,495 |
| 2024 | $30,805 | $2,543,505 | $2,009,686 | $533,819 |
| 2023 | $30,351 | $2,493,633 | $1,970,281 | $523,352 |
| 2022 | $29,999 | $2,444,740 | $1,931,649 | $513,091 |
| 2021 | $29,406 | $2,396,805 | $1,893,774 | $503,031 |
| 2020 | $28,799 | $2,372,230 | $1,874,356 | $497,874 |
| 2019 | $28,480 | $2,325,716 | $1,837,604 | $488,112 |
| 2018 | $27,696 | $2,280,115 | $1,801,573 | $478,542 |
| 2017 | $27,209 | $2,235,408 | $1,766,249 | $469,159 |
| 2016 | $26,496 | $2,191,577 | $1,731,617 | $459,960 |
| 2015 | $26,237 | $2,158,658 | $1,705,607 | $453,051 |
| 2014 | $25,707 | $2,116,374 | $1,672,197 | $444,177 |
Source: Public Records
Map
Nearby Homes
- 961 Channing Ave
- 1033 Guinda St
- 755 Homer Ave
- 637 Channing Ave
- 671 Kingsley Ave
- 20 Kent Place
- 1218 Middlefield Rd
- 707 Webster St
- 560 Addison Ave
- 1301 Forest Ave
- 1101 Hamilton Ave
- 536 Addison Ave
- 555 Byron St Unit 104
- 759 Cowper St
- 535 Kingsley Ave
- 1119 Hopkins Ave
- 447 Homer Ave
- 1027 Waverley St
- 756 Waverley St
- 326 Addison Ave
- 954 Addison Ave
- 934 Addison Ave
- 940 Addison Ave
- 936 Addison Ave
- 928 Addison Ave
- 960 Addison Ave
- 956 Addison Ave
- 937 Addison Ave
- 920 Addison Ave
- 951 Addison Ave
- 958 Addison Ave
- 962 Addison Ave
- 931 Addison Ave
- 949 Addison Ave
- 935 Lincoln Ave
- 937 Lincoln Ave
- 918 Addison Ave
- 968 Addison Ave
- 953 Channing Ave
- 959 Addison Ave Unit B