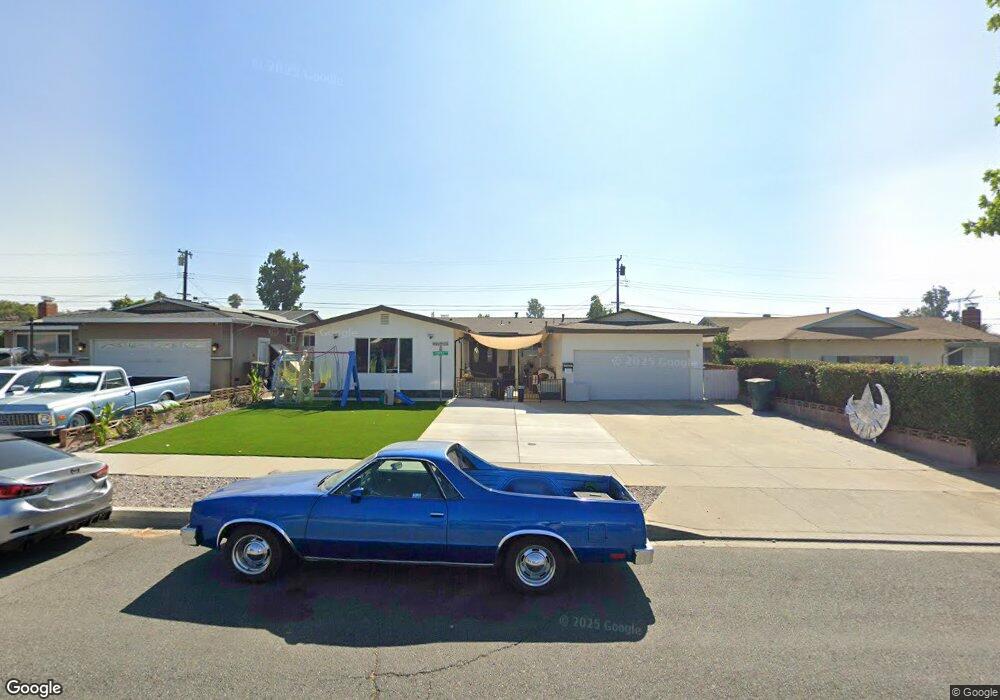
938 N Gardenia Ave Ontario, CA 91762
Downtown Ontario NeighborhoodEstimated Value: $665,000 - $699,406
3
Beds
2
Baths
1,713
Sq Ft
$400/Sq Ft
Est. Value
About This Home
This home is located at 938 N Gardenia Ave, Ontario, CA 91762 and is currently estimated at $685,102, approximately $399 per square foot. 938 N Gardenia Ave is a home located in San Bernardino County with nearby schools including Elderberry Elementary, Vernon Middle School, and Montclair High School.
Ownership History
Date
Name
Owned For
Owner Type
Purchase Details
Closed on
Jul 26, 2010
Sold by
Cortez Teodoro
Bought by
Cortez Lucy A Yamas
Current Estimated Value
Home Financials for this Owner
Home Financials are based on the most recent Mortgage that was taken out on this home.
Original Mortgage
$218,507
Outstanding Balance
$146,845
Interest Rate
4.87%
Mortgage Type
FHA
Estimated Equity
$538,257
Purchase Details
Closed on
Dec 31, 1994
Sold by
Kammerer Tommy
Bought by
Kammerer Lisa Michelle
Home Financials for this Owner
Home Financials are based on the most recent Mortgage that was taken out on this home.
Original Mortgage
$61,500
Interest Rate
9.25%
Purchase Details
Closed on
Dec 14, 1994
Sold by
Kammerer Lisa Michelle
Bought by
Kammerer Tommy and Kammerer Lisa Michelle
Home Financials for this Owner
Home Financials are based on the most recent Mortgage that was taken out on this home.
Original Mortgage
$61,500
Interest Rate
9.25%
Create a Home Valuation Report for This Property
The Home Valuation Report is an in-depth analysis detailing your home's value as well as a comparison with similar homes in the area
Home Values in the Area
Average Home Value in this Area
Purchase History
| Date | Buyer | Sale Price | Title Company |
|---|---|---|---|
| Cortez Lucy A Yamas | -- | Chicago Title Inland Empire | |
| Cortez Lucy A Yamas | $221,500 | Chicago Title Inland Empire | |
| Kammerer Lisa Michelle | -- | -- | |
| Kammerer Tommy | -- | Northern Counties Title |
Source: Public Records
Mortgage History
| Date | Status | Borrower | Loan Amount |
|---|---|---|---|
| Open | Cortez Lucy A Yamas | $218,507 | |
| Previous Owner | Kammerer Tommy | $61,500 |
Source: Public Records
Tax History Compared to Growth
Tax History
| Year | Tax Paid | Tax Assessment Tax Assessment Total Assessment is a certain percentage of the fair market value that is determined by local assessors to be the total taxable value of land and additions on the property. | Land | Improvement |
|---|---|---|---|---|
| 2025 | $3,583 | $339,898 | $98,650 | $241,248 |
| 2024 | $3,583 | $333,234 | $96,716 | $236,518 |
| 2023 | $2,973 | $272,701 | $94,822 | $177,879 |
| 2022 | $2,933 | $267,354 | $92,963 | $174,391 |
| 2021 | $2,915 | $262,112 | $91,140 | $170,972 |
| 2020 | $2,864 | $259,424 | $90,205 | $169,219 |
| 2019 | $2,840 | $254,337 | $88,436 | $165,901 |
| 2018 | $2,800 | $249,350 | $86,702 | $162,648 |
| 2017 | $4,279 | $244,461 | $85,002 | $159,459 |
| 2016 | $4,143 | $239,667 | $83,335 | $156,332 |
| 2015 | $4,135 | $236,067 | $82,083 | $153,984 |
| 2014 | $2,496 | $231,443 | $80,475 | $150,968 |
Source: Public Records
Map
Nearby Homes
- 1352 W Granada Ct
- 1164 W I St
- 853 N Jasmine Ave
- 1415 W Harvard Place
- 827 N Jasmine Ave
- 1111 W J St
- 1105 W Berkeley Ct
- 1353 W Princeton St
- 1163 W Princeton St
- 1324 W Oakcrest Paseo
- 1326 W Oakcrest Paseo
- Plan 3 at Canopy
- Plan 4 at Canopy
- 9932 Santa Anita Ave
- 456 N Begonia Ave
- 1111 W E St
- 9966 Vernon Ave
- 5635 Palo Verde St
- 1147 W D St
- 1054 Hollowell St
- 944 N Gardenia Ave
- 930 N Gardenia Ave
- 937 N Fuchsia Ave
- 950 N Gardenia Ave
- 924 N Gardenia Ave
- 929 N Fuchsia Ave
- 943 N Fuchsia Ave
- 949 N Fuchsia Ave
- 923 N Fuchsia Ave
- 937 N Gardenia Ave
- 943 N Gardenia Ave
- 929 N Gardenia Ave
- 956 N Gardenia Ave
- 918 N Gardenia Ave
- 923 N Gardenia Ave
- 949 N Gardenia Ave
- 955 N Fuchsia Ave
- 962 N Gardenia Ave
- 910 N Gardenia Ave
- 917 N Gardenia Ave