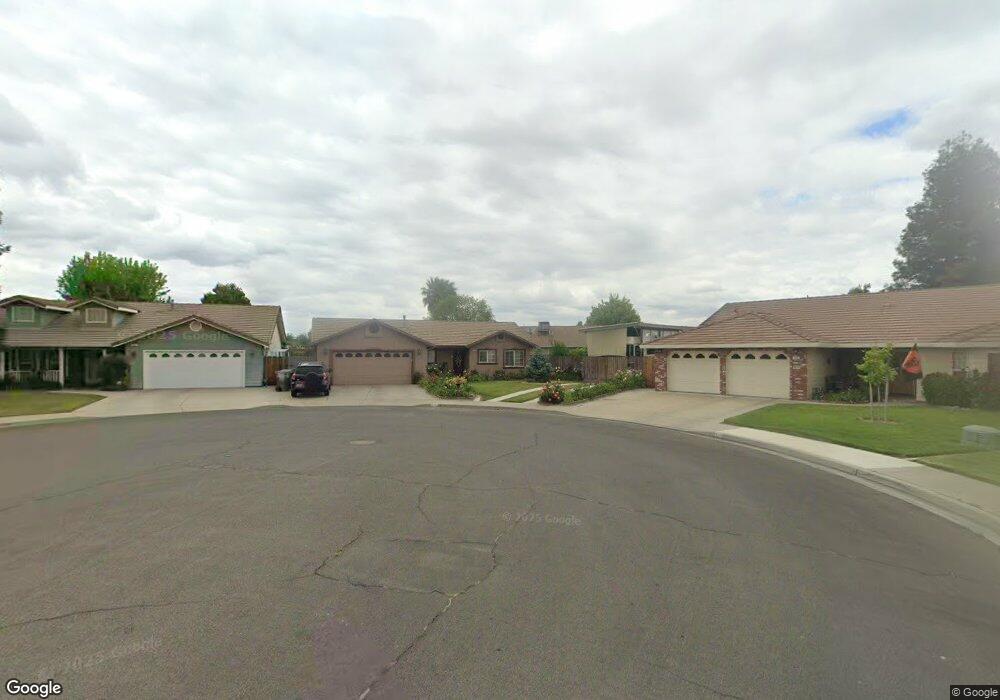
938 Polo Ct Turlock, CA 95380
Estimated Value: $372,000 - $471,000
3
Beds
2
Baths
1,416
Sq Ft
$309/Sq Ft
Est. Value
About This Home
This home is located at 938 Polo Ct, Turlock, CA 95380 and is currently estimated at $436,975, approximately $308 per square foot. 938 Polo Ct is a home located in Stanislaus County with nearby schools including Crowell Elementary School, Marvin A. Dutcher Middle School, and Turlock Junior High School.
Ownership History
Date
Name
Owned For
Owner Type
Purchase Details
Closed on
Jan 6, 2021
Sold by
Toledo Dimas B
Bought by
Toledo Dimas B and Toledo Mary A
Current Estimated Value
Purchase Details
Closed on
Feb 19, 2015
Sold by
Toledo Dimas B and Toledo Mary A
Bought by
Toledo Dimas B
Home Financials for this Owner
Home Financials are based on the most recent Mortgage that was taken out on this home.
Original Mortgage
$113,000
Outstanding Balance
$86,035
Interest Rate
3.6%
Mortgage Type
New Conventional
Estimated Equity
$350,940
Purchase Details
Closed on
Nov 1, 1995
Sold by
Taylor Gary Don and Taylor Doris Marie
Bought by
Toledo Dimas B and Toledo Mary A
Home Financials for this Owner
Home Financials are based on the most recent Mortgage that was taken out on this home.
Original Mortgage
$46,500
Interest Rate
7.87%
Create a Home Valuation Report for This Property
The Home Valuation Report is an in-depth analysis detailing your home's value as well as a comparison with similar homes in the area
Purchase History
| Date | Buyer | Sale Price | Title Company |
|---|---|---|---|
| Toledo Dimas B | -- | None Available | |
| Toledo Dimas B | -- | Old Republic | |
| Toledo Dimas B | $122,000 | Chicago Title Co |
Source: Public Records
Mortgage History
| Date | Status | Borrower | Loan Amount |
|---|---|---|---|
| Open | Toledo Dimas B | $113,000 | |
| Previous Owner | Toledo Dimas B | $46,500 |
Source: Public Records
Tax History
| Year | Tax Paid | Tax Assessment Tax Assessment Total Assessment is a certain percentage of the fair market value that is determined by local assessors to be the total taxable value of land and additions on the property. | Land | Improvement |
|---|---|---|---|---|
| 2025 | $2,081 | $198,682 | $48,850 | $149,832 |
| 2024 | $2,041 | $194,788 | $47,893 | $146,895 |
| 2023 | $2,036 | $190,969 | $46,954 | $144,015 |
| 2022 | $2,010 | $187,226 | $46,034 | $141,192 |
| 2021 | $1,979 | $183,556 | $45,132 | $138,424 |
| 2020 | $1,965 | $181,675 | $44,670 | $137,005 |
| 2019 | $1,931 | $178,114 | $43,795 | $134,319 |
| 2018 | $1,927 | $174,623 | $42,937 | $131,686 |
| 2017 | $1,881 | $171,200 | $42,096 | $129,104 |
| 2016 | $1,757 | $167,844 | $41,271 | $126,573 |
| 2015 | $1,817 | $165,324 | $40,652 | $124,672 |
| 2014 | $1,799 | $162,086 | $39,856 | $122,230 |
Source: Public Records
Map
Nearby Homes
- 2098 Joett Dr
- 2230 Aspenwood Dr
- 961 Countryside Dr
- 990 Shawnan Dr
- 1400 N Tully Rd Unit 120
- 1400 N Tully Rd Unit 91
- 1400 N Tully Rd Unit 168
- 2065 Cody Ct
- 500 N Tully Rd Unit 39
- 500 N Tully Rd
- 2450 Fulkerth Rd
- 2400 Fulkerth Rd
- 1249 Magic Sands Way
- 1253 Magic Sands Way
- 1270 Magic Sands Way
- 2631 Polous Dr
- 200 N Tully Rd
- 2175 W Main St
- 1330 Dianne Dr
- 900 W Canal Dr Unit 100
Your Personal Tour Guide
Ask me questions while you tour the home.