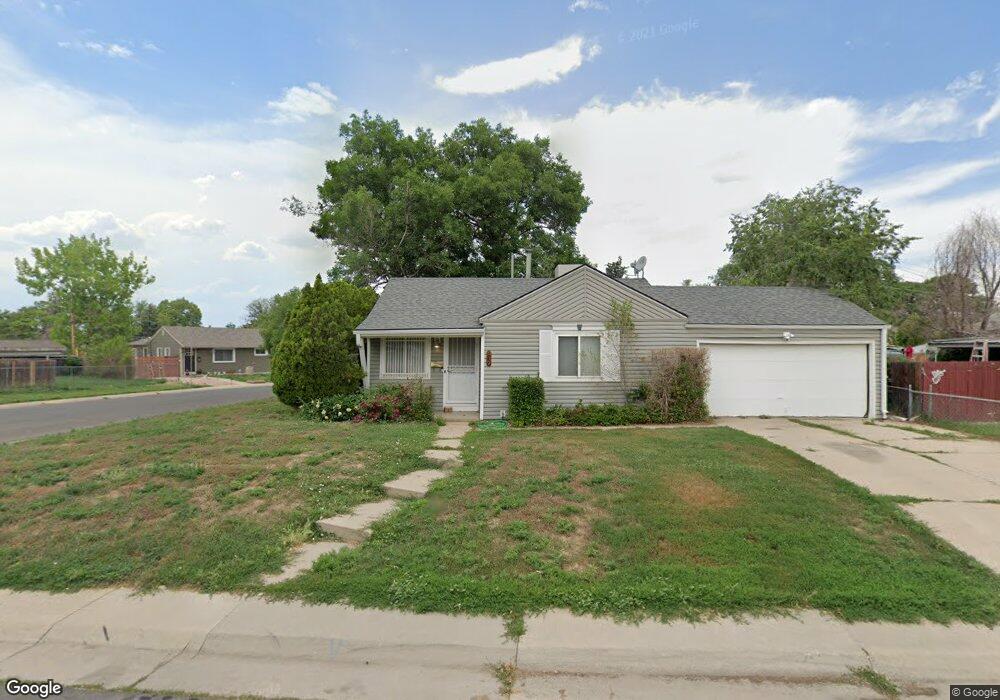
939 Lansing St Aurora, CO 80010
Del Mar Parkway NeighborhoodEstimated Value: $341,000 - $378,000
2
Beds
1
Bath
736
Sq Ft
$487/Sq Ft
Est. Value
About This Home
This home is located at 939 Lansing St, Aurora, CO 80010 and is currently estimated at $358,517, approximately $487 per square foot. 939 Lansing St is a home located in Arapahoe County with nearby schools including Kenton Elementary School, Del Mar Academy, and North Middle School Health Sciences & Technology.
Ownership History
Date
Name
Owned For
Owner Type
Purchase Details
Closed on
Aug 3, 2015
Sold by
Lacey Patricia A and The Estate Of Alice K Smith
Bought by
1858 Investment Llc
Current Estimated Value
Home Financials for this Owner
Home Financials are based on the most recent Mortgage that was taken out on this home.
Original Mortgage
$121,164
Interest Rate
4.13%
Mortgage Type
Purchase Money Mortgage
Purchase Details
Closed on
Nov 1, 1978
Sold by
Conversion Arapco
Bought by
Conversion Arapco
Purchase Details
Closed on
Jul 4, 1776
Bought by
Conversion Arapco
Create a Home Valuation Report for This Property
The Home Valuation Report is an in-depth analysis detailing your home's value as well as a comparison with similar homes in the area
Home Values in the Area
Average Home Value in this Area
Purchase History
| Date | Buyer | Sale Price | Title Company |
|---|---|---|---|
| 1858 Investment Llc | $107,500 | None Available | |
| Conversion Arapco | -- | -- | |
| Conversion Arapco | -- | -- |
Source: Public Records
Mortgage History
| Date | Status | Borrower | Loan Amount |
|---|---|---|---|
| Closed | 1858 Investment Llc | $121,164 |
Source: Public Records
Tax History Compared to Growth
Tax History
| Year | Tax Paid | Tax Assessment Tax Assessment Total Assessment is a certain percentage of the fair market value that is determined by local assessors to be the total taxable value of land and additions on the property. | Land | Improvement |
|---|---|---|---|---|
| 2024 | $2,240 | $24,100 | -- | -- |
| 2023 | $2,240 | $24,100 | $0 | $0 |
| 2022 | $2,027 | $20,183 | $0 | $0 |
| 2021 | $2,092 | $20,183 | $0 | $0 |
| 2020 | $2,000 | $19,205 | $0 | $0 |
| 2019 | $1,989 | $19,205 | $0 | $0 |
| 2018 | $1,797 | $16,999 | $0 | $0 |
| 2017 | $1,564 | $16,999 | $0 | $0 |
| 2016 | $973 | $10,356 | $0 | $0 |
| 2015 | $939 | $10,356 | $0 | $0 |
| 2014 | $582 | $6,177 | $0 | $0 |
| 2013 | -- | $6,460 | $0 | $0 |
Source: Public Records
Map
Nearby Homes
- 820 Lansing St
- 812 Lansing St
- 855 Newark St
- 995 Newark St
- 740 Moline St
- 11612 Del Mar Pkwy
- 770 Kenton St
- 800 Nile St
- 1170 Kingston St
- 775 Joliet St
- 995 Ironton St
- 841 N Oakland St
- 1173 Joliet St
- 885 Ironton St
- 850 Oakland St
- 1248 Lima St
- 1207 Joliet St
- 10595 E Lowry Place
- 945 Paris St
- 1213 Jamaica St