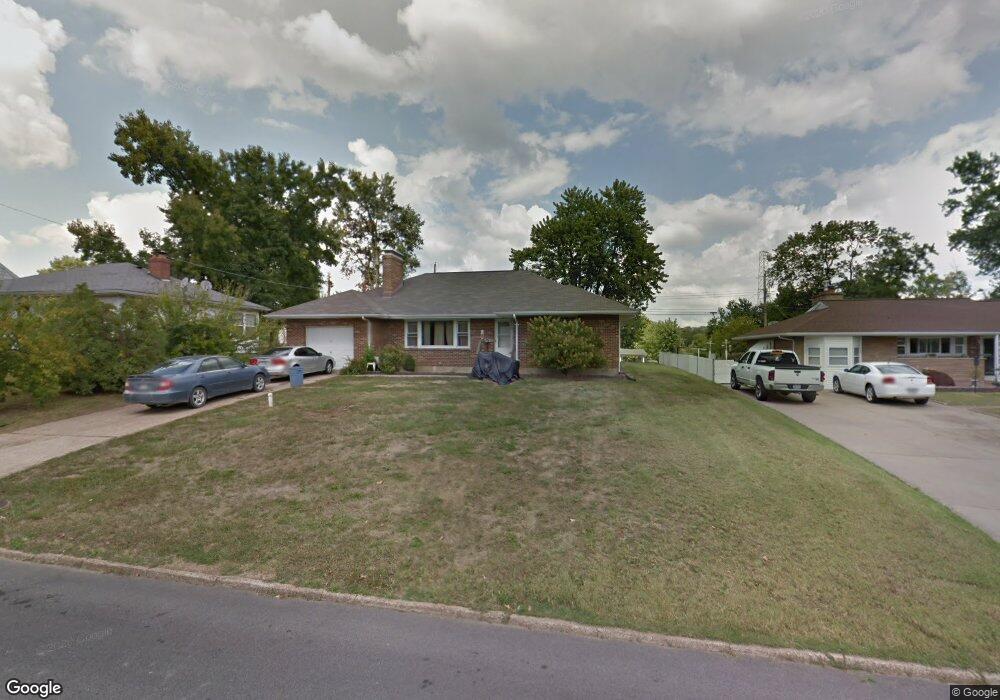
939 N 4th St Festus, MO 63028
Festus/Crystal City NeighborhoodEstimated Value: $160,907 - $229,000
--
Bed
--
Bath
1,390
Sq Ft
$143/Sq Ft
Est. Value
About This Home
This home is located at 939 N 4th St, Festus, MO 63028 and is currently estimated at $198,477, approximately $142 per square foot. 939 N 4th St is a home located in Jefferson County with nearby schools including Festus Elementary School, Festus Intermediate School, and Festus Middle School.
Ownership History
Date
Name
Owned For
Owner Type
Purchase Details
Closed on
Dec 1, 2003
Sold by
Raker Norma Lee and Raker Lindsey K
Bought by
Raker Norma Lee and Raker Lindsey K
Current Estimated Value
Purchase Details
Closed on
Jun 11, 2003
Sold by
Raker Norma Lee and Trust Of Norma Lee Raker
Bought by
Raker Norma Lee
Home Financials for this Owner
Home Financials are based on the most recent Mortgage that was taken out on this home.
Original Mortgage
$30,000
Interest Rate
5.56%
Mortgage Type
Purchase Money Mortgage
Purchase Details
Closed on
Aug 18, 2000
Sold by
Raker Norma Lee
Bought by
Raker Norma L
Create a Home Valuation Report for This Property
The Home Valuation Report is an in-depth analysis detailing your home's value as well as a comparison with similar homes in the area
Home Values in the Area
Average Home Value in this Area
Purchase History
| Date | Buyer | Sale Price | Title Company |
|---|---|---|---|
| Raker Norma Lee | -- | Capital Title | |
| Raker Norma Lee | -- | Capital Title | |
| Raker Norma L | -- | -- |
Source: Public Records
Mortgage History
| Date | Status | Borrower | Loan Amount |
|---|---|---|---|
| Closed | Raker Norma Lee | $30,000 |
Source: Public Records
Tax History Compared to Growth
Tax History
| Year | Tax Paid | Tax Assessment Tax Assessment Total Assessment is a certain percentage of the fair market value that is determined by local assessors to be the total taxable value of land and additions on the property. | Land | Improvement |
|---|---|---|---|---|
| 2025 | $1,166 | $22,300 | $1,500 | $20,800 |
| 2024 | $1,166 | $20,600 | $1,500 | $19,100 |
| 2023 | $1,166 | $20,600 | $1,500 | $19,100 |
| 2022 | $1,160 | $20,600 | $1,500 | $19,100 |
| 2021 | $1,161 | $20,600 | $1,500 | $19,100 |
| 2020 | $1,094 | $18,200 | $1,200 | $17,000 |
| 2019 | $1,094 | $18,200 | $1,200 | $17,000 |
| 2018 | $986 | $18,200 | $1,200 | $17,000 |
| 2017 | $986 | $18,200 | $1,200 | $17,000 |
| 2016 | $904 | $16,600 | $1,300 | $15,300 |
| 2015 | $899 | $16,600 | $1,300 | $15,300 |
| 2013 | -- | $16,000 | $1,300 | $14,700 |
Source: Public Records
Map
Nearby Homes