Estimated Value: $207,782 - $243,000
3
Beds
1
Bath
1,200
Sq Ft
$185/Sq Ft
Est. Value
About This Home
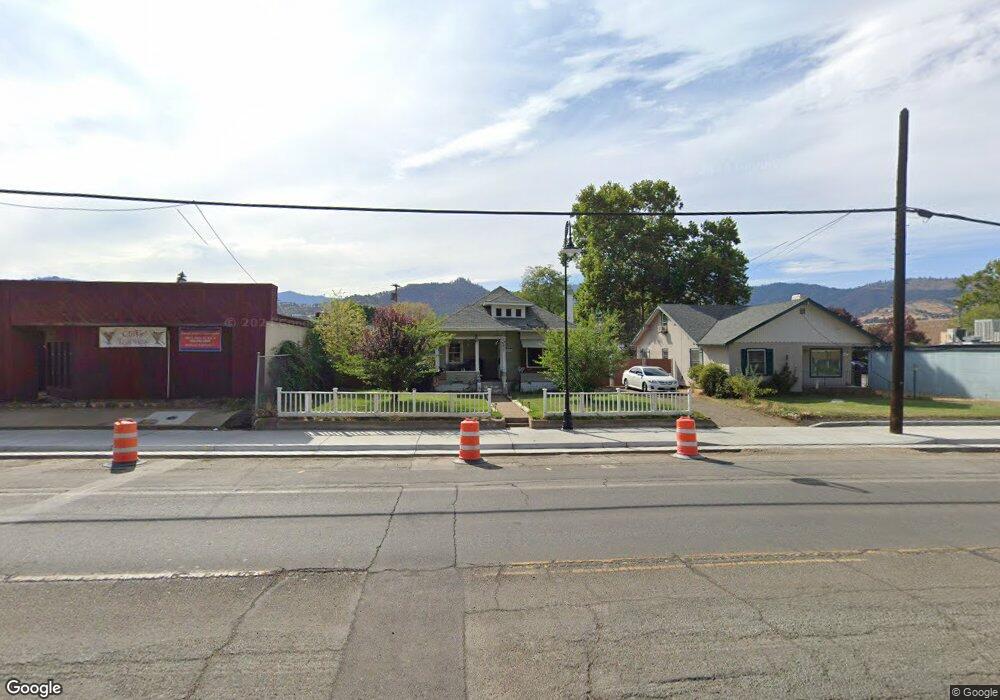
This home is located at 939 S Main St, Yreka, CA 96097 and is currently estimated at $221,696, approximately $184 per square foot. 939 S Main St is a home located in Siskiyou County with nearby schools including Evergreen Elementary School, Jackson Street Elementary School, and Yreka High School.
Ownership History
Date
Name
Owned For
Owner Type
Purchase Details
Closed on
Feb 10, 2021
Sold by
Moody Walter R
Bought by
Department Of Transportation
Current Estimated Value
Purchase Details
Closed on
Feb 28, 2017
Sold by
Svb Resolution Holdings Llc
Bought by
Moody Walter R
Home Financials for this Owner
Home Financials are based on the most recent Mortgage that was taken out on this home.
Original Mortgage
$70,000
Interest Rate
4.09%
Mortgage Type
New Conventional
Purchase Details
Closed on
Nov 1, 2016
Sold by
Core James Bradley
Bought by
Svb Resolution Holdings Inc
Purchase Details
Closed on
Jun 20, 2012
Sold by
Ralston Sandra Lee
Bought by
Core Charles Wallace
Purchase Details
Closed on
Jan 27, 2003
Sold by
Core Cecelia D
Bought by
Ralston Sandra L
Create a Home Valuation Report for This Property
The Home Valuation Report is an in-depth analysis detailing your home's value as well as a comparison with similar homes in the area
Home Values in the Area
Average Home Value in this Area
Purchase History
| Date | Buyer | Sale Price | Title Company |
|---|---|---|---|
| Department Of Transportation | -- | None Available | |
| Moody Walter R | $75,000 | Mt Shasta Title & Escrow | |
| Svb Resolution Holdings Inc | $91,687 | Mstc | |
| Core Charles Wallace | -- | None Available | |
| Ralston Sandra L | -- | -- |
Source: Public Records
Mortgage History
| Date | Status | Borrower | Loan Amount |
|---|---|---|---|
| Previous Owner | Moody Walter R | $70,000 |
Source: Public Records
Tax History
| Year | Tax Paid | Tax Assessment Tax Assessment Total Assessment is a certain percentage of the fair market value that is determined by local assessors to be the total taxable value of land and additions on the property. | Land | Improvement |
|---|---|---|---|---|
| 2025 | $1,249 | $121,855 | $58,026 | $63,829 |
| 2023 | $1,249 | $117,125 | $55,774 | $61,351 |
| 2022 | $1,202 | $114,830 | $54,681 | $60,149 |
| 2021 | $1,182 | $112,579 | $53,609 | $58,970 |
| 2020 | $1,174 | $111,426 | $53,060 | $58,366 |
| 2019 | $1,153 | $109,242 | $52,020 | $57,222 |
| 2018 | $1,131 | $107,100 | $51,000 | $56,100 |
| 2017 | $1,110 | $105,000 | $50,000 | $55,000 |
| 2016 | $988 | $100,796 | $53,050 | $47,746 |
| 2015 | $972 | $99,283 | $52,254 | $47,029 |
| 2014 | $935 | $97,339 | $51,231 | $46,108 |
Source: Public Records
Map
Nearby Homes
Your Personal Tour Guide
Ask me questions while you tour the home.