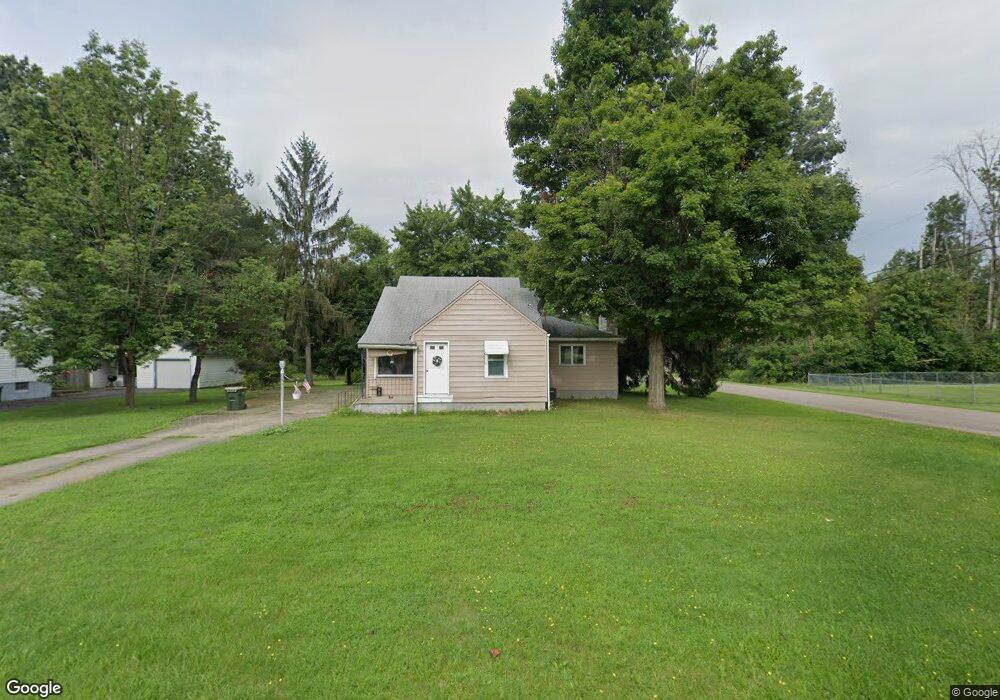
94 Benton St Youngstown, OH 44515
Austintown NeighborhoodEstimated Value: $134,000 - $183,000
3
Beds
1
Bath
1,439
Sq Ft
$115/Sq Ft
Est. Value
About This Home
This home is located at 94 Benton St, Youngstown, OH 44515 and is currently estimated at $165,128, approximately $114 per square foot. 94 Benton St is a home located in Mahoning County with nearby schools including Austintown Elementary School, Austintown Intermediate School, and Austintown Middle School.
Ownership History
Date
Name
Owned For
Owner Type
Purchase Details
Closed on
May 15, 2023
Bought by
Iaguilli Larry Mark
Current Estimated Value
Home Financials for this Owner
Home Financials are based on the most recent Mortgage that was taken out on this home.
Original Mortgage
$109,250
Outstanding Balance
$106,173
Interest Rate
6.32%
Mortgage Type
New Conventional
Estimated Equity
$58,955
Purchase Details
Closed on
May 12, 2023
Sold by
Dewees Deborah L
Bought by
Iaguilli Larry Mark
Home Financials for this Owner
Home Financials are based on the most recent Mortgage that was taken out on this home.
Original Mortgage
$109,250
Outstanding Balance
$106,173
Interest Rate
6.32%
Mortgage Type
New Conventional
Estimated Equity
$58,955
Purchase Details
Closed on
Dec 15, 2006
Sold by
Iagulli Viola A and Iagulli Mark
Bought by
Dewees Deborah L
Purchase Details
Closed on
Dec 31, 1975
Bought by
Iagulli Mark and Iagulli Viola A
Create a Home Valuation Report for This Property
The Home Valuation Report is an in-depth analysis detailing your home's value as well as a comparison with similar homes in the area
Home Values in the Area
Average Home Value in this Area
Purchase History
| Date | Buyer | Sale Price | Title Company |
|---|---|---|---|
| Iaguilli Larry Mark | $115,000 | -- | |
| Iaguilli Larry Mark | $115,000 | None Listed On Document | |
| Iaguilli Larry Mark | $115,000 | None Listed On Document | |
| Dewees Deborah L | $289,700 | None Listed On Document | |
| Dewees Deborah L | $289,700 | None Listed On Document | |
| Iagulli Mark | -- | -- |
Source: Public Records
Mortgage History
| Date | Status | Borrower | Loan Amount |
|---|---|---|---|
| Open | Iaguilli Larry Mark | $109,250 | |
| Closed | Iaguilli Larry Mark | $109,250 |
Source: Public Records
Tax History Compared to Growth
Tax History
| Year | Tax Paid | Tax Assessment Tax Assessment Total Assessment is a certain percentage of the fair market value that is determined by local assessors to be the total taxable value of land and additions on the property. | Land | Improvement |
|---|---|---|---|---|
| 2024 | $2,088 | $45,610 | $7,690 | $37,920 |
| 2023 | $2,105 | $45,610 | $7,690 | $37,920 |
| 2022 | $1,484 | $25,750 | $7,690 | $18,060 |
| 2021 | $1,485 | $25,750 | $7,690 | $18,060 |
| 2020 | $1,491 | $25,750 | $7,690 | $18,060 |
| 2019 | $1,418 | $22,290 | $6,990 | $15,300 |
| 2018 | $1,367 | $22,290 | $6,990 | $15,300 |
| 2017 | $1,364 | $22,290 | $6,990 | $15,300 |
| 2016 | $1,479 | $23,940 | $6,990 | $16,950 |
| 2015 | $1,435 | $23,940 | $6,990 | $16,950 |
| 2014 | $1,442 | $23,940 | $6,990 | $16,950 |
| 2013 | $1,428 | $23,940 | $6,990 | $16,950 |
Source: Public Records
Map
Nearby Homes
- 112 Benton St
- 124 S Inglewood Ave
- 5231 W Rockwell Rd
- 148 N Kimberly Ave
- 148 Marcia Dr
- 3794-3796 Mahoning Ave
- 5109 W Elmwood Ave
- 170 Idaho Rd
- 5451 Virginia Dr
- 138 N Canfield Niles Rd
- 111 Ohltown Rd
- 316 S Inglewood Ave
- 176 N Canfield Niles Rd
- 5560 Norquest Blvd
- 1228 Cavalcade Dr
- 5318 Pinecrest Ave
- 5559 London Dr
- 125 Fitch Blvd Unit 224
- 5179 Willow Crest Ave
- 5677 Mahoning Ave
- 84 Benton St
- 5031 Argonne Dr
- 110 Benton St
- 74 Benton St
- 91 Benton St
- 83 Benton St
- 66 Benton St
- 5196 Argonne Dr
- 5030 Argonne Dr
- 73 Benton St
- 5045 Argonne Dr
- 4976 Argonne Dr
- 62 Benton St
- 114 Benton St
- 108 Atlanta Ave Unit 110
- 115 Atlanta Ave Unit 117
- 63 Benton St
- 96 Kleber Ave
- 92 Kleber Ave
- 56 Benton St